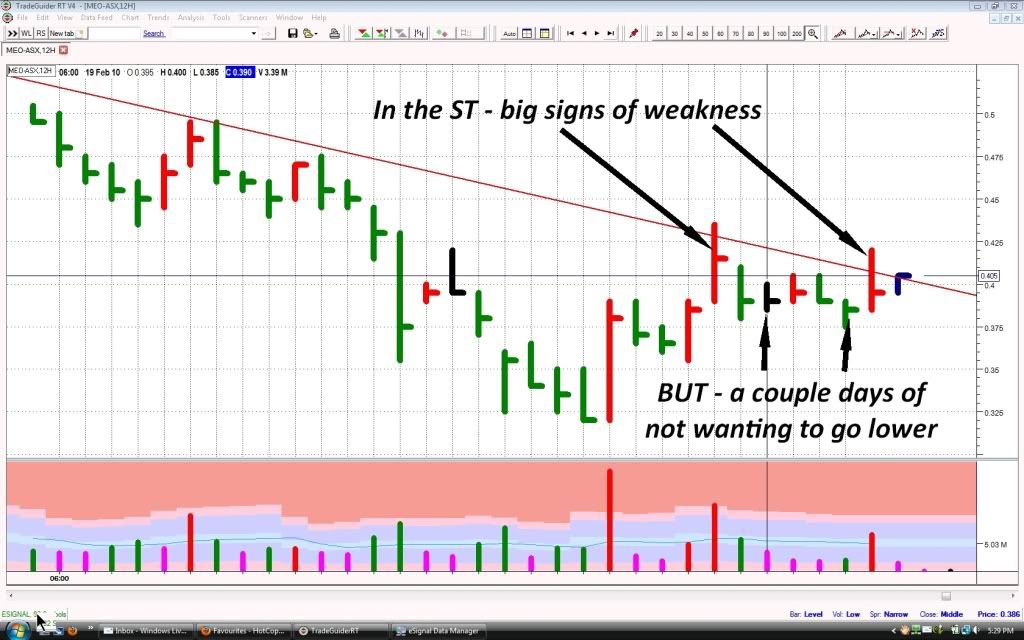
Hope I am wrong but got this bad feeling that today may be the start of this previous weakness showing from this previous chart of mine.
.............
I think MEO in the ST is a little confused in it's direction as well. We have had two big signs of ST weakness at this price level, two high volume up days closing lowish, normally indicating selling, but then we have had a couple days of strength, low volume down days indicating a lack of selling, relatively at the same price level . NORMALLY IT SHOULD HAVE ROLLED OVER AND HEADED SOUTH BUT NOT YET.
If I was considering to buy MEO at this point of time, I would maybe wait for it to clear those two weak bars, buy in at say 43cents plus, on a low volume down days as illustrated on the chart by those two strong day.
............
Also yesterday was a slight increase to the down indicating a little bit more weakness. lol all holders
- Forums
- ASX - By Stock
- MEO
- chart?
chart?, page-5
-
- There are more pages in this discussion • 3 more messages in this thread...
You’re viewing a single post only. To view the entire thread just sign in or Join Now (FREE)
Featured News
Add MEO (ASX) to my watchlist
Currently unlisted public company.
The Watchlist
EQN
EQUINOX RESOURCES LIMITED.
Zac Komur, MD & CEO
Zac Komur
MD & CEO
SPONSORED BY The Market Online


