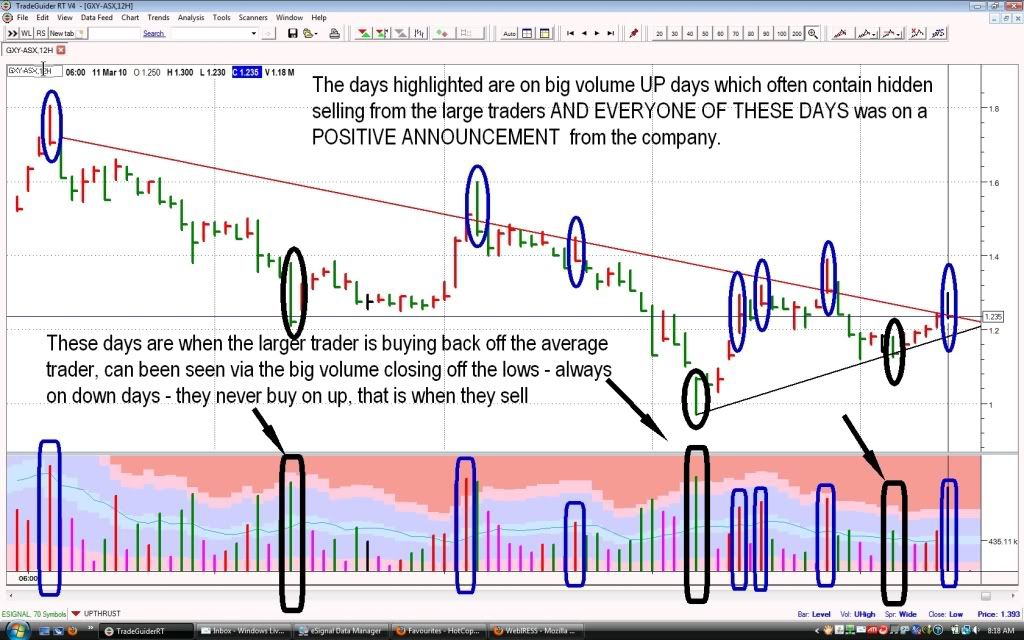
Hi ST, sorry I missed giving my thoughts on those converging lines on the chart, I have posted a new one and as you can see the descending line is being formed by most of the weak days - these ones being when the " actors " large traders are offloading into the buying from the positive announcements. These are always on UP days with big volume and the day closing off the highs. When I draw trendlines I like to get the line as close as possibly to all of the CLOSES of the day, this obviously misses out on the high tails or whatever.
If I was considering to buy from a positive announcement I would wait till after it to see if there is any of this hidden selling contained - this is displayed on the chart by a narrow low volume down day following closely - indicating a lack of selling - that is my trigger.
With the bottom uptrending line you can see it is created by linking the areas of strength of late - this is where some buying from the larger trader has occurred. As for what will happen now, who knows really we just wait and see but in the ST it may signal a break up of this triangle - that's my GUESS at the moment, but my next entry will be after more strength turns up and then is successfully tested as per the 5Feb and then tested the next day - low volume DOWN day indicating to the large trader that the selling has ceased. lol
Add to My Watchlist
What is My Watchlist?


