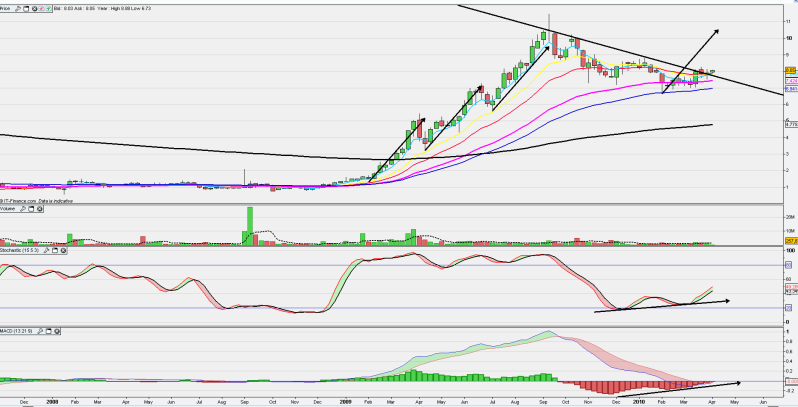
Hey guys i have just noticed this chart on the weekly thought i would share.
i have put some more information on my blog address is in my twitter below
just like the way this is lining up, i have gotten buy signals on both my weekly MACD and DMI which is normally a strong sign when they happen at the same time although not shown on this chart. I have mearly showen the divergance here, a confirmation of the move and i will be grabbing some ext back again :)
its been to long lol
- Forums
- ASX - By Stock
- EXT
- weekly chart
EXT
excite technology services ltd
Add to My Watchlist
0.00%
 !
0.9¢
weekly chart
Featured News
Add to My Watchlist
What is My Watchlist?
A personalised tool to help users track selected stocks. Delivering real-time notifications on price updates, announcements, and performance stats on each to help make informed investment decisions.
 (20min delay) (20min delay)
|
|||||
|
Last
0.9¢ |
Change
0.000(0.00%) |
Mkt cap ! $18.65M | |||
| Open | High | Low | Value | Volume |
| 0.8¢ | 0.9¢ | 0.8¢ | $1.313K | 150.3K |
Buyers (Bids)
| No. | Vol. | Price($) |
|---|---|---|
| 19 | 5621147 | 0.8¢ |
Sellers (Offers)
| Price($) | Vol. | No. |
|---|---|---|
| 0.9¢ | 2774527 | 1 |
View Market Depth
| No. | Vol. | Price($) |
|---|---|---|
| 19 | 5621147 | 0.008 |
| 3 | 652100 | 0.007 |
| 4 | 1775000 | 0.006 |
| 2 | 1280000 | 0.005 |
| 2 | 1598000 | 0.004 |
| Price($) | Vol. | No. |
|---|---|---|
| 0.009 | 2774527 | 1 |
| 0.010 | 9611381 | 18 |
| 0.011 | 2425096 | 8 |
| 0.012 | 500000 | 1 |
| 0.013 | 506500 | 3 |
| Last trade - 16.10pm 26/08/2025 (20 minute delay) ? |
Featured News
| EXT (ASX) Chart |


