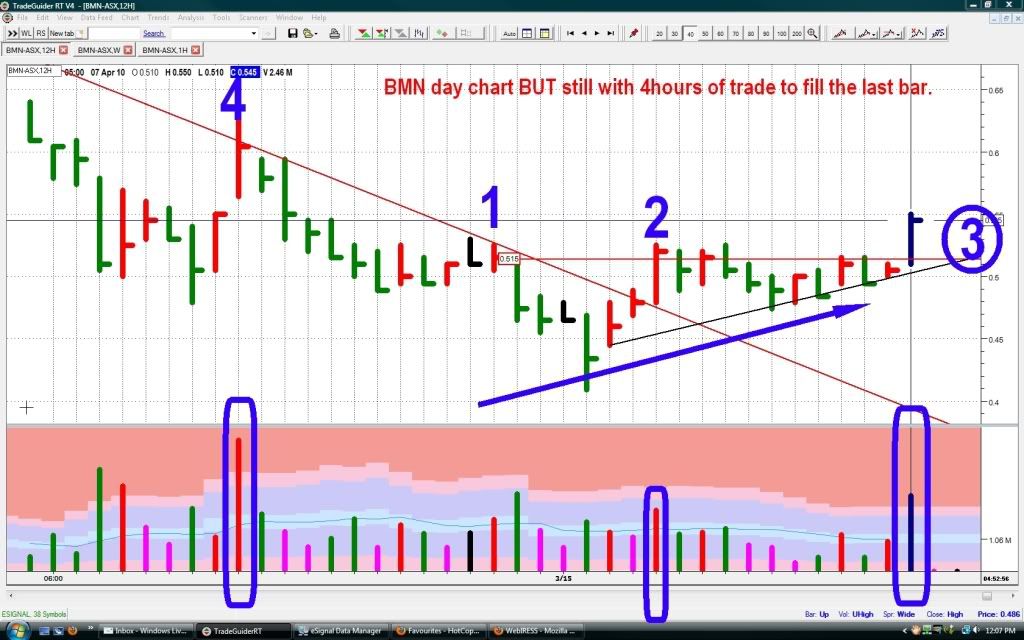
Hi Funkymonk, yes agree with your thoughts on the other tread, here is the current day chart for BMN, it is obviously not complete with still about 4 hours of trade to go, so we have to remember that.
Normally with big volume up days like today is going to finish, we rate them as high risk entries because we don't know the intentions of the big boys. A much better low risk entry just like Funkymonk has been suggesting is to wait and see what their intentions are and that may present itself in a couple of days time roughly around the NO. 3. on the chart, a low volume down day - indicating no more selling that may have been present in today's bar.
But then again today could be VERY bullish it is trying to breakup and above the previous resistance level of No. 1 & 2. so then imo we STILL wait for our low risk entry. Have a look at No. 4. on the chart and the huge volume on that day on an up day, some days can be good for our bank balances while others may not be, we just have to enter on the LOW RISK ones that have been suggested. lol all holders
- Forums
- ASX - By Stock
- BMN
- chart
chart, page-53
-
- There are more pages in this discussion • 137 more messages in this thread...
You’re viewing a single post only. To view the entire thread just sign in or Join Now (FREE)
Featured News
Add BMN (ASX) to my watchlist
 (20min delay) (20min delay)
|
|||||
|
Last
$2.74 |
Change
0.010(0.37%) |
Mkt cap ! $481.6M | |||
| Open | High | Low | Value | Volume |
| $2.73 | $2.80 | $2.70 | $1.473M | 534.9K |
Buyers (Bids)
| No. | Vol. | Price($) |
|---|---|---|
| 2 | 416 | $2.73 |
Sellers (Offers)
| Price($) | Vol. | No. |
|---|---|---|
| $2.81 | 2500 | 1 |
View Market Depth
| No. | Vol. | Price($) |
|---|---|---|
| 1 | 366 | 2.730 |
| 2 | 5474 | 2.720 |
| 4 | 6368 | 2.700 |
| 1 | 7707 | 2.690 |
| 2 | 1372 | 2.680 |
| Price($) | Vol. | No. |
|---|---|---|
| 2.810 | 2500 | 1 |
| 2.840 | 3000 | 1 |
| 2.850 | 7000 | 2 |
| 2.870 | 10000 | 1 |
| 2.880 | 3500 | 2 |
| Last trade - 16.10pm 26/07/2024 (20 minute delay) ? |
Featured News
| BMN (ASX) Chart |


