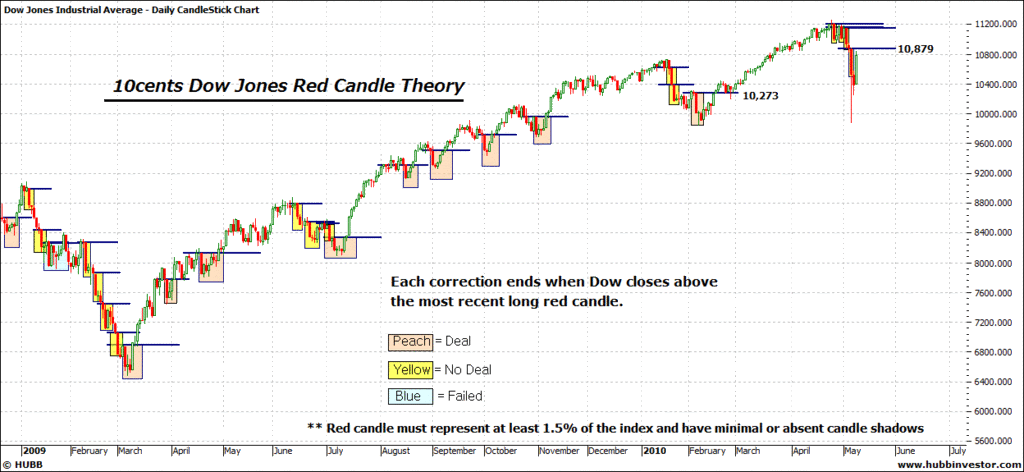
I posted this chart on the weekend - but I made a fundamental error which I wish to correct.
It's just my own theory on when to go long or short. The chart is self-explanatory.
My mistake was in using Friday's candle in my calculations when in fact the candle didn't qualify because the real body was less than 1.5% of the index and it had a long tail.
My level therefore is the top of Thursdays candle. Yes it had a long tail but that was no ordinary tail.
For now I'm still short orientated. A Dow close above 10,879 would see me long.
10cents
- Forums
- ASX - By Stock
- XJO
- turbulent tuesday
turbulent tuesday, page-11
Featured News
Add XJO (ASX) to my watchlist
 (20min delay) (20min delay)
|
|||||
|
Last
8,279.2 |
Change
55.200(0.67%) |
Mkt cap ! n/a | |||
| Open | High | Low |
| 8,224.0 | 8,284.8 | 8,224.0 |
Featured News
| XJO (ASX) Chart |
The Watchlist
ACW
ACTINOGEN MEDICAL LIMITED
Will Souter, CFO
Will Souter
CFO
Previous Video
Next Video
SPONSORED BY The Market Online


