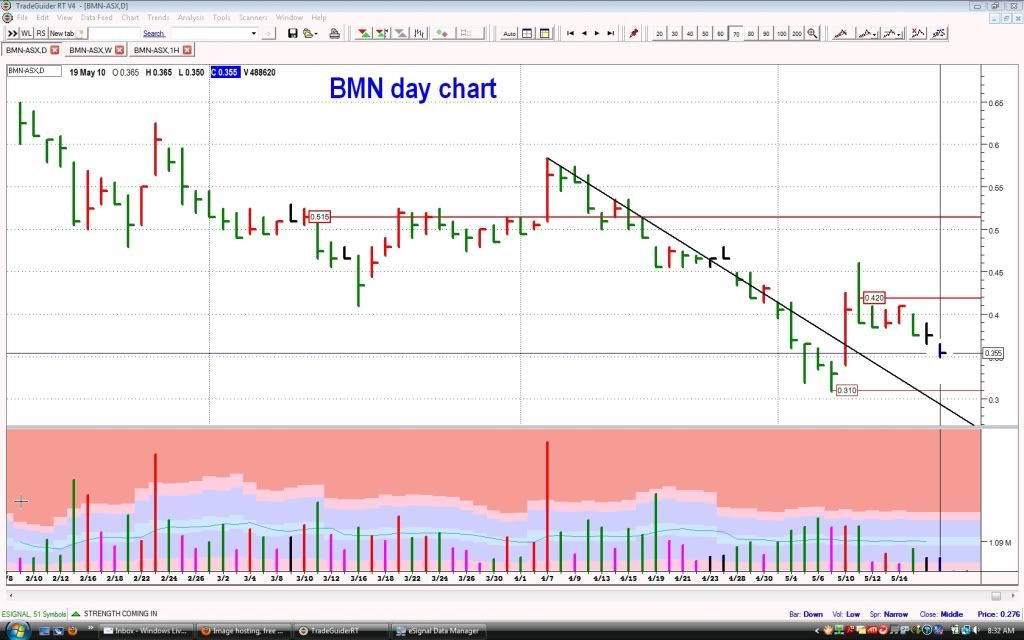
For those interested here is an updated chart for BMN - as we can see the day the DOW took the big plunge 7May our low was 31cents - then was followed by that announcement, also shown are key resistance levels in the short term that have to be overcome if and when we stop this slide
- Forums
- ASX - By Stock
- BMN
- bmn 19may chart
BMN
bannerman energy ltd
Add to My Watchlist
1.16%
 !
$3.50
bmn 19may chart
Featured News
Add to My Watchlist
What is My Watchlist?
A personalised tool to help users track selected stocks. Delivering real-time notifications on price updates, announcements, and performance stats on each to help make informed investment decisions.
 (20min delay) (20min delay)
|
|||||
|
Last
$3.50 |
Change
0.040(1.16%) |
Mkt cap ! $718.9M | |||
| Open | High | Low | Value | Volume |
| $3.37 | $3.56 | $3.37 | $14.32M | 4.085M |
Buyers (Bids)
| No. | Vol. | Price($) |
|---|---|---|
| 1 | 500 | $3.49 |
Sellers (Offers)
| Price($) | Vol. | No. |
|---|---|---|
| $3.54 | 1000 | 1 |
View Market Depth
| No. | Vol. | Price($) |
|---|---|---|
| 1 | 500 | 3.490 |
| 1 | 2000 | 3.420 |
| 1 | 160 | 3.400 |
| 1 | 1474 | 3.370 |
| 1 | 6060 | 3.300 |
| Price($) | Vol. | No. |
|---|---|---|
| 3.540 | 1000 | 1 |
| 3.580 | 6000 | 1 |
| 3.600 | 7000 | 3 |
| 3.630 | 8771 | 1 |
| 3.640 | 1123 | 3 |
| Last trade - 16.10pm 19/09/2025 (20 minute delay) ? |
Featured News
| BMN (ASX) Chart |


