Hey guys, been a while since I've posted some charts - I may be a bit rusty, but here's a couple from me:
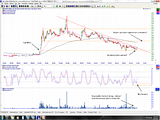
ptialv, PDY looks like it might be breaking out of that downtrend. It bottomed out in line with that gap created in June last year. Stochastic looks like a nice setup with a higher bounce. While volume is higher than of late, its only just touched the 50 day MA. For a convincing breakout I'd like to see some more volume. Target looks like the bottom of that former ranging channel at 22:
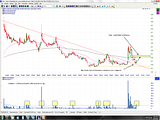
5hareholder, the most important thing for me on that ESI chart is the back-test of that dynamic resistance now acting as support, and that it looks like having formed a higher swing bottom. Volumes of > 25M look like being quite reliably associated with price advances in the last 12 months, so I'd want to see volume remain above that level for evidence of further northward movement. That gap between 3.5 and 4 needs to be filled, and may cause any advance to pause (its also sittgin just above the 195EMA), so that'd be the immediate target.
Cheers, Sharks.
- Forums
- Charts
- weekend charting 10 july 2010
weekend charting 10 july 2010, page-62
-
- There are more pages in this discussion • 27 more messages in this thread...
You’re viewing a single post only. To view the entire thread just sign in or Join Now (FREE)


