This analyst has quite a different approach to technical analysis. Gold's performance this week has been encouraging, you can almost see the banks passing their short positions to the hedge funds this week. It may just be over right now. This was written at the end of last week.Silver’s Message
Before moving on to the general market let’s mention silver and what is going on beneath the surface. We all know that sentiment in the sector is rock bottom. No one wants silver now three years after everyone wanted it when it made its vertical run in the summer of 2020. The silver stocks are the red headed step child of the market, but therein lies opportunity. In the month of August it seemed a daily event that the market would take a silver stock behind the barn to be shot. SILV, HL, FSM, GSVRF, EXK, NEWP (in June) all had their purges. It appears that this was the washout opportunity as there are growing signs that silver is exhibiting internal strength and could surprise everyone to the upside.
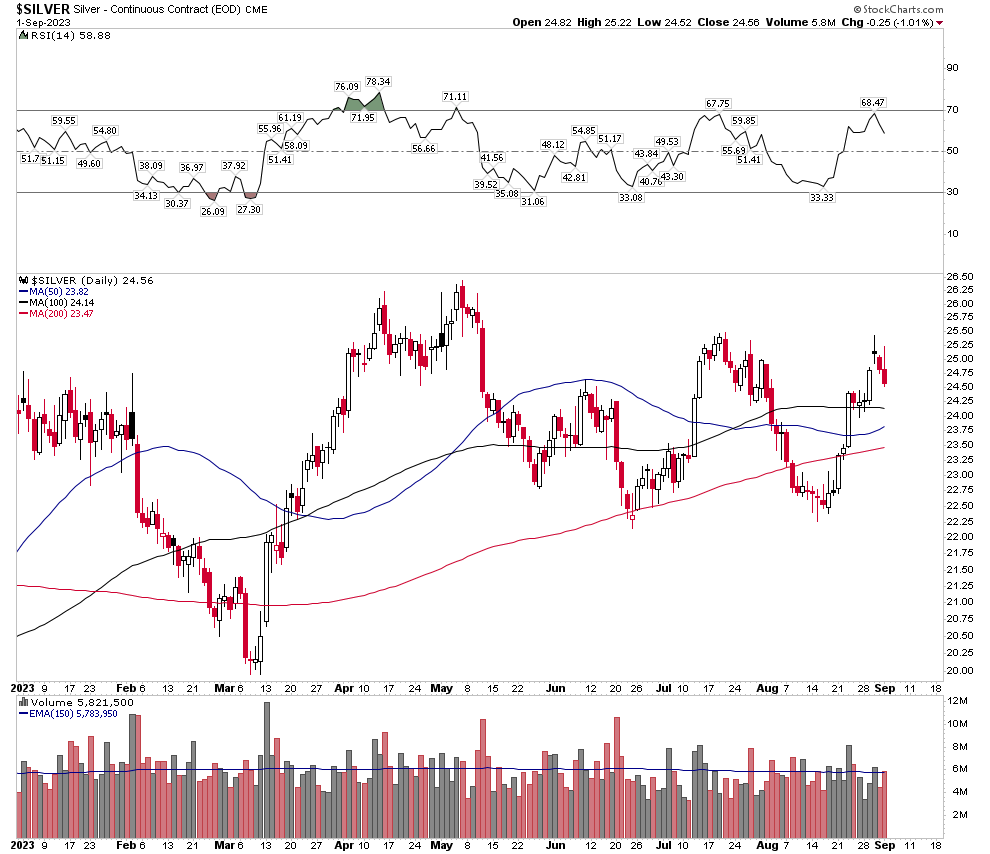
What is special about the below chart?
What is so special is that this is the first time since 2011 that the silver price has penetrated the three simple moving averages (50,100,200) without the commercial banks adding to their short positions. If one ascribes to the ability of the commercials to suppress the silver price through their operations on the COMEX this is a highly significant moment. Monumental actually, because this is how the rinse and repeat process is run. The commercials short on rising prices above the 3 moving averages and cover on falling prices near the bottom. It has been going on for 40 years. If the commercials don’t increase their shorts on rising prices the rinse and repeat cycle wont occur and for now, it just stopped.
Why you ask? Perhaps, because the commercials are not dumb and they see the developing physical shortage in silver. Decades of low silver prices have resulted in decreased production supply and now increasing industrial demand is creating an outright physical shortage. This shortage has recently manifested itself in a run on the silver ETFs and extremely high rates of physical turnover on the COMEX. In fact over the past few weeks the ETFs have been getting bled white with withdrawals in PSLV and SLV. Silver’s price has increased over the past 2 weeks, yet the ETFs have suffered withdrawals. It’s normal to do the opposite. When price rises, silver flows into the ETFs not out! The ETFs represent investment supply and are being used to fill a gap between supply and industrial demand. In other words these are two forces in the early stages of a collision course which resolves itself by rising prices.
Friends these are powerful subsurface signs that things are about to change.
US Consumer Deflation results in BIG SILVER RALLY'S, page-362


Add to My Watchlist
What is My Watchlist?
 (20min delay) (20min delay)
|
|||||
|
Last
2.8¢ |
Change
0.001(3.70%) |
Mkt cap ! $48.51M | |||
| Open | High | Low | Value | Volume |
| 2.8¢ | 2.9¢ | 2.7¢ | $75.58K | 2.696M |
Buyers (Bids)
| No. | Vol. | Price($) |
|---|---|---|
| 2 | 1019283 | 2.8¢ |
Sellers (Offers)
| Price($) | Vol. | No. |
|---|---|---|
| 2.9¢ | 4069412 | 17 |
View Market Depth
| Last trade - 16.10pm 25/07/2025 (20 minute delay) ? |
| IVR (ASX) Chart |