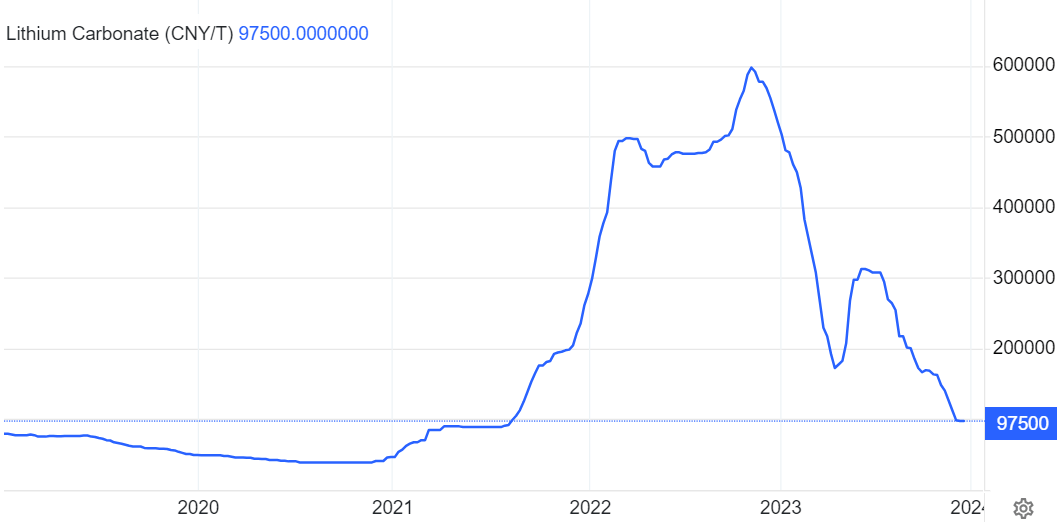
The lithium market in 2023 was very different than the years that preceded it. However, there is a potential of 2024 to mark a year of a resurgence. The tumultuous journey of spot lithium prices in 2023, from a peak of 600k to a settling point around 100k in December, has set the stage for a potential phoenix-like rise. This blog explores the potentially exciting prospect of an inverted head and shoulders setup, visible in the spot lithium chart, and explores what this could mean for lithium investors seeking a unique buy opportunity in the coming years.
As a refresher, these were some of our 2023 writings:
Lithium Testing A Double Bottom, Major Secular Buy Opportunity May Be In The Making (Oct 2023)
When is the Right Time to Buy Lithium Technology & EV Stocks? (Aug 2023)
Lithium Price Stabilizing At Key Retracement Level And Implications For Lithium Investors (June 2023)
The Lithium Market Is Bottoming, A New Lithium Bull Run Is Looming (May 2023)
The Journey of Lithium in 2023: Before we look into the potential setup, let’s briefly revisit the rollercoaster ride of spot lithium prices in 2023. From a significant decline to 130k, a bounce to 333k, and a subsequent fall back to around 100k, the market experienced turbulence. However, amidst this volatility, a notable pattern is emerging—one that has caught the attention of investors.
A potential Inverted Head and Shoulders Setup in the Making: The spot lithium chart for December 2023 presents an intriguing formation—an inverted head and shoulders. This pattern, if dominant, holds the promise of a tremendously bullish long-term setup. The inverted head and shoulders is a classic reversal pattern, often signaling a shift from a downtrend to an uptrend. Now, the question is: How can investors know if this setup is indeed in the making?
Confirmation and Validation: The key lies in the journey ahead. To confirm the tremendously bullish long-term structure, watch for a bounce that propels spot lithium to 333k in 2024. This upward movement should be followed by a dip to 200k, creating a higher low. This sequence is crucial—it signifies the strength of the potential reversal. The ultimate confirmation of the tremendously bullish setup rests on this specific movement.
Invalidation Warning: However, every story has its challenges. An inverted head and shoulders setup would be invalidated if spot lithium fails to surpass the 180k mark. This level acts as a critical point of resistance—if it cannot be overcome, the bullish narrative may lose its momentum.
Conclusion: Watching the Phoenix Take Flight In conclusion, the lithium market is potentially at a fascinating crossroads, presenting a potential super bullish setup with the inverted head and shoulders pattern. Investors are urged to keep a keen eye on the spot lithium chart, observing the bounce to 333k and subsequent dip to 200k for confirmation. The stakes are high, and the confirmation of this setup could signal a unique buy opportunity for lithium investors over the next 2 to 3 years.


