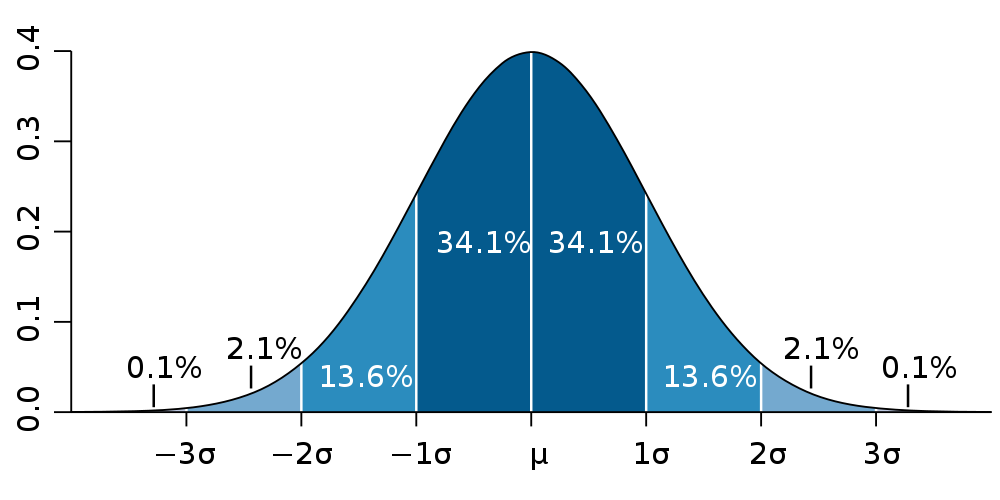
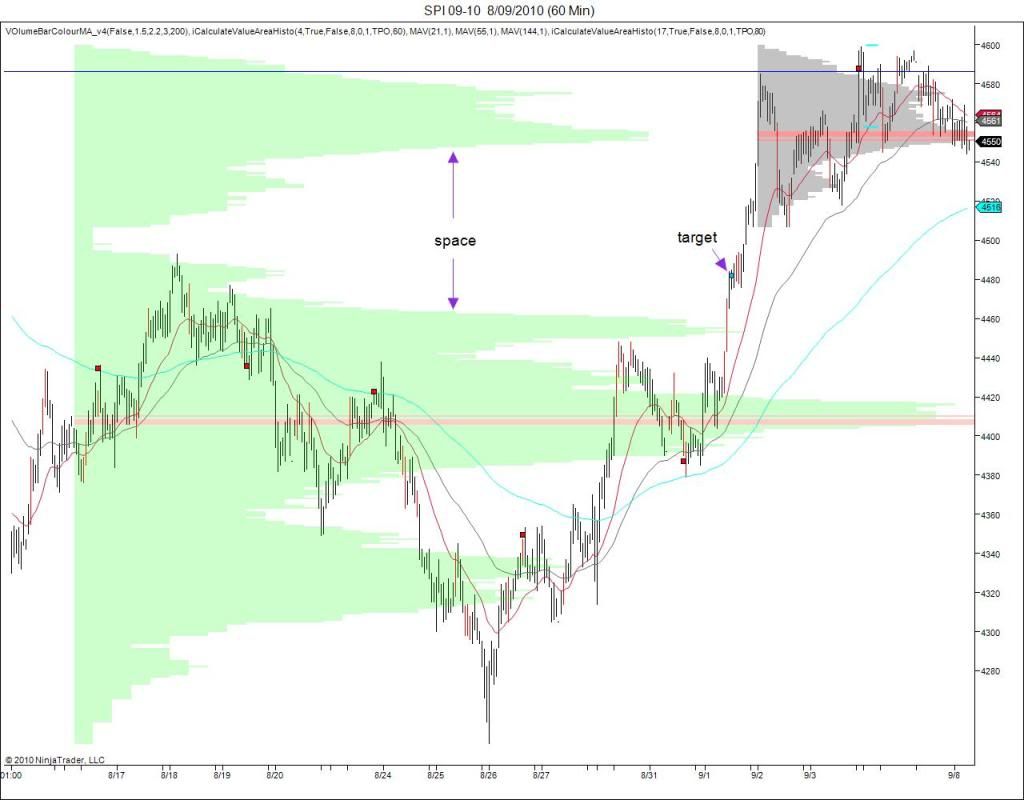
I'm posting a digrame of a stastical instrument called a bell curve , below that a spi chart with 2 of these curves overlayed.IF we took the hight measurement of all the xjo'rs
we would end up at the center of the bell curve, that represents the average or the mean , and in terms of markets the value price ..to get te value price the market has to move from the high extreme to the low and back again ...blah blah ...anyway it appears we are about to fill in some space in the larger timeframe curve.I mentioned last week the afternoon tight range one day as important ..and I've marked that as a possible target in the medium term .
good luck and good trading to you .

- Forums
- ASX - By Stock
- XJO
- spi road map page 12
spi road map page 12, page-36
-
- There are more pages in this discussion • 6 more messages in this thread...
You’re viewing a single post only. To view the entire thread just sign in or Join Now (FREE)
Featured News
Add XJO (ASX) to my watchlist
 (20min delay) (20min delay)
|
|||||
|
Last
8,255.6 |
Change
-10.600(0.13%) |
Mkt cap ! n/a | |||
| Open | High | Low |
| 8,266.2 | 8,266.2 | 8,215.8 |
Featured News
| XJO (ASX) Chart |
The Watchlist
NUZ
NEURIZON THERAPEUTICS LIMITED
Michael Thurn, CEO & MD
Michael Thurn
CEO & MD
Previous Video
Next Video
SPONSORED BY The Market Online


