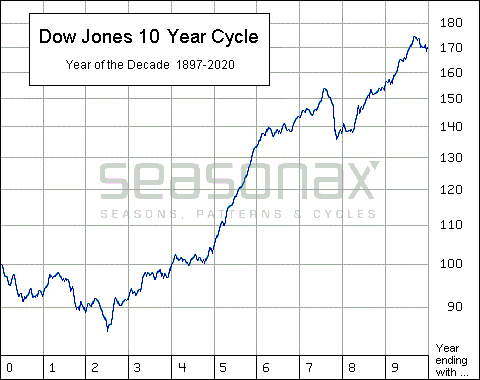
Looking at a 10 year cycle and a 30 month cycle ( 2year 6 month) retained with individual Fib's
The data from the bottom chart is from 1897 - 2003
The data in the top chart fills in the gap for the missing 7 years to current date.
Fibs show in the 30 month cycles, 50% play an important consolidating/ turn point being continually tested each cycle.
Number 5 in green with the vertical red line would be the averaged out cyclic low of the 10 year according to previous data on the S&P500 chart
For our current rally ( bullish )to continue we need to be retesting the support of the 50% which would mean a bullish breakout possibly from October into early next year restesting the support of 50%. Very bullish if this was to happen.
If we keep at this level and drop it will be anyones guess where the price will go, but it will be a lot lowere than where we closed today.
As Danube has pointed out price has come back to this same point we are now for many years - 13 in total.
From a personal point I wish I knew what I know now before entering the market and throwing hard earned money away fighting a trend in 2008.....never heard of bulls, bears, black swans or any other type of animal in the stock market I just thought everything went up not down!!

This data and chart below was obtained from www.gnetwork.com.au. This was in Jan 2010 and now close to the same level
The 50% is at 10360 points, Gann (a master of technical analysis) tells us, that the 50% point is the most important of all. It is a good guide as to the strength of a particular stock or index. To prove the Dow Jones will go higher, it should break 5%+ higher than the 50% Retrace level, or 10880.
Have a good week end all
Spider
- Forums
- ASX - By Stock
- XJO
- weekend
XJO
s&p/asx 200
Add to My Watchlist
1.37%
 !
8,757.2
weekend, page-7
Featured News
Add to My Watchlist
What is My Watchlist?
A personalised tool to help users track selected stocks. Delivering real-time notifications on price updates, announcements, and performance stats on each to help make informed investment decisions.
 (20min delay) (20min delay)
|
|||||
|
Last
8,757.2 |
Change
118.200(1.37%) |
Mkt cap ! n/a | |||
| Open | High | Low |
| 8,639.0 | 8,776.4 | 8,639.0 |
Featured News
| XJO (ASX) Chart |


