Hi everyone, only time this weekend for one chart and it's one of BTA that I've posted on their stock thread
........
" PS In the current environment, if I could work out how to reliably sell at $1-10 and buy back at $0-90 it would be very appealing. "
Kangaroo, well why didn't you say so :))
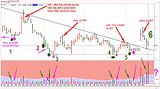
I've done up a chart of BTA for about the last 3months and show 4 successful trades following those boring old rules that I abide by, plus their exits
all entries on chart have the pink dot beneath them and were taken on close of trade
NO1. has further strength to the left off the chart
NO2. marked on the chart fails the criteria so no trade would be taken there, anyone got thoughts of why it failed ? why is it different from the other 4entries
NO3. is different from the rest. I'll let you work out why that one passed the test
and now we wait for NO6, who's going to pick the correct day to enter and exit this one
P.S. no shorts/selling manipulators were taken into consideration for any of these trades as well as any FA announcements or takeover conspiracy's :)) just following the chart
weekend charting 17 - 19 september, page-82
-
- There are more pages in this discussion • 109 more messages in this thread...


You’re viewing a single post only. To view the entire thread just sign in or Join Now (FREE)
Featured News
Featured News
The Watchlist
RCE
RECCE PHARMACEUTICALS LTD
James Graham / Dr Alan Dunton, MD & CEO / Non-Executive Director
James Graham / Dr Alan Dunton
MD & CEO / Non-Executive Director
SPONSORED BY The Market Online