G'Day Pete, was looking at that spark programme, looks nuts let me know how you get on with it as I would be very interested in getting it.
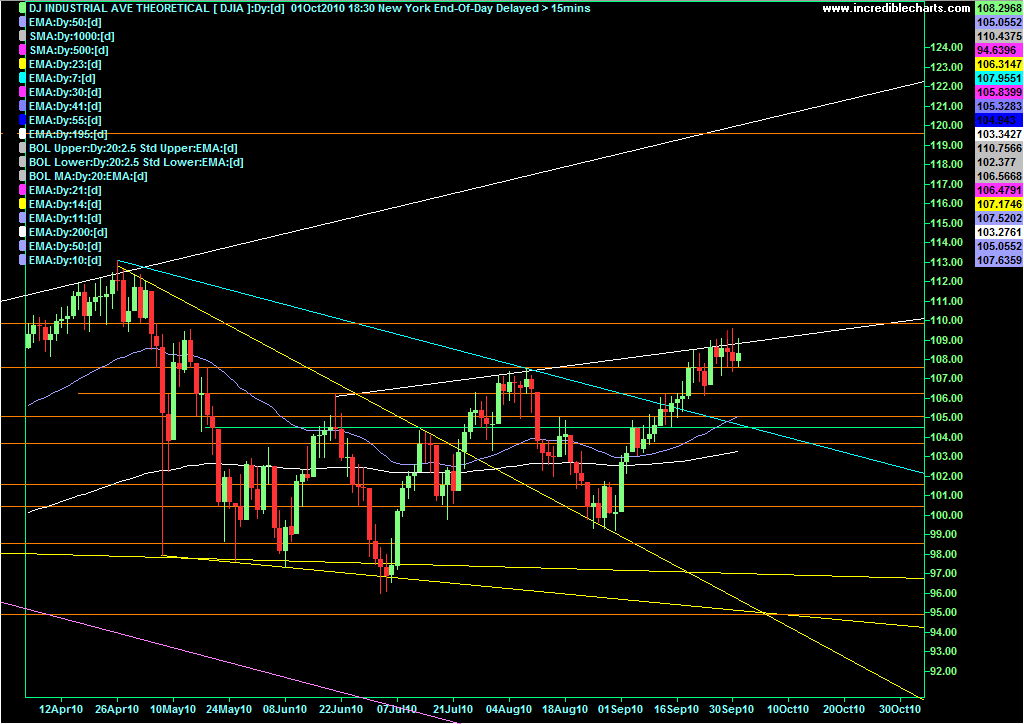
Here's the DJIA chart with the wrong ma's ? The set up I have for both the 50 and the 200 are as follows :
Time Period (2.1000periods) : 50
Time Period (None..1000periods) : None
Time Period (None..1000periods) : None
Exponential
ps - thanks for getting back to me re this I really appreciate it. I have also noticed that the candle plots on my chart are different to yours from yesterday mornings chart that you put up? My DJIA chart showing last 9 sessions hitting or under resistance (white ascending trendline) whereas yours showing only last few sessions have just hit the same line??

- Forums
- ASX - Day Trading
- daytrades oct 1 afternoon
daytrades oct 1 afternoon, page-224
-
- There are more pages in this discussion • 1 more message in this thread...
You’re viewing a single post only. To view the entire thread just sign in or Join Now (FREE)


