[Response to another post outside AON]:
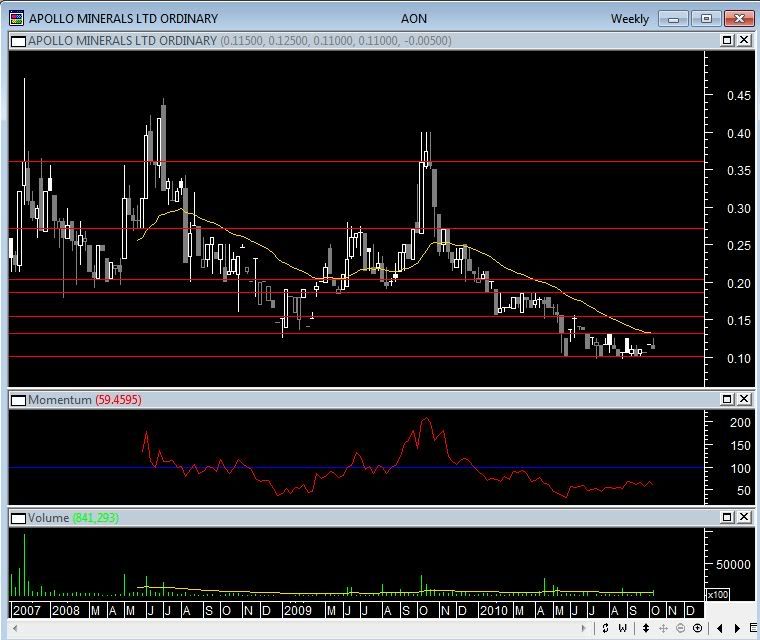
Hi screwloose, I've had a look at the AON chart and some background info behind it. Personally it is not a chart that would attract my attention yet but that's only because my criteria is different and I recognise there are many methods and timeframes to make (and lose) money on the markets.
Having said that the chart suggests that the 10c mark is where the basement price is as the market is willing to support it whenever it returns to these levels. The fact that ARMCO recently stumped up +$4M for 20% of AON at 15c suggests that there could be value buying between 10-13c which is where it has been ranging since June. But because volume has been flat across the board it suggests to me that the market has little interest in the stock and will continue to plod along without clear direction.
A buy and hold strategy with some patience thrown is certainly required for AON. And one would only enter in anticipation of some announcement of significance to shake it out of the current range - and hopefully higher. Not the best looking chart I have seen and volatile too but that's probably because it is thinly traded. Good luck!
- Forums
- ASX - By Stock
- AON
- still ranging - needs news ...
AON
apollo minerals limited
Add to My Watchlist
0.00%
 !
0.6¢
still ranging - needs news ...
Featured News
Add to My Watchlist
What is My Watchlist?
A personalised tool to help users track selected stocks. Delivering real-time notifications on price updates, announcements, and performance stats on each to help make informed investment decisions.
 (20min delay) (20min delay)
|
|||||
|
Last
0.6¢ |
Change
0.000(0.00%) |
Mkt cap ! $5.570M | |||
| Open | High | Low | Value | Volume |
| 0.6¢ | 0.6¢ | 0.6¢ | $9.687K | 1.614M |
Buyers (Bids)
| No. | Vol. | Price($) |
|---|---|---|
| 3 | 385216 | 0.6¢ |
Sellers (Offers)
| Price($) | Vol. | No. |
|---|---|---|
| 0.7¢ | 1729186 | 8 |
View Market Depth
| No. | Vol. | Price($) |
|---|---|---|
| 3 | 385216 | 0.006 |
| 12 | 3303205 | 0.005 |
| 7 | 4465000 | 0.004 |
| 3 | 2333333 | 0.003 |
| 5 | 3500000 | 0.002 |
| Price($) | Vol. | No. |
|---|---|---|
| 0.007 | 1729186 | 8 |
| 0.008 | 4291976 | 4 |
| 0.009 | 1721482 | 7 |
| 0.010 | 1394000 | 2 |
| 0.011 | 1200000 | 1 |
| Last trade - 13.18pm 16/09/2025 (20 minute delay) ? |
Featured News
| AON (ASX) Chart |


