
Weekly Wrap. Week ended 26/4/24. XJO stumbles at first hurdle.
It was a short week this week with the ASX closed on Thursday for Anzac Day.
The first three days of the week were positive - but that took the XJO up to its first hurdle. It stumbled on Friday at that level and fell back strongly after disappointing CPI figures and a down night on Wall Street.It's often scary just how well Technical Analysis works.
On Wednesday, the XJO hit the 50-Day MA and retreated back to its opening level, finishing flat, down just -0.01%.
That rejection at the 50-Day MA was ominous. On Friday, XJO fell heavily from Wednesday's close. Friday was down -1.39% and most of the gains on Monday and Tuesday were erased.
XJO finished up for the week, just +0.11%. Virtually flat.
That was in stark contrast to the American market where SP500 was up +2.67% mostly on the back of surging Tech stocks such as Alphabet and IBM.
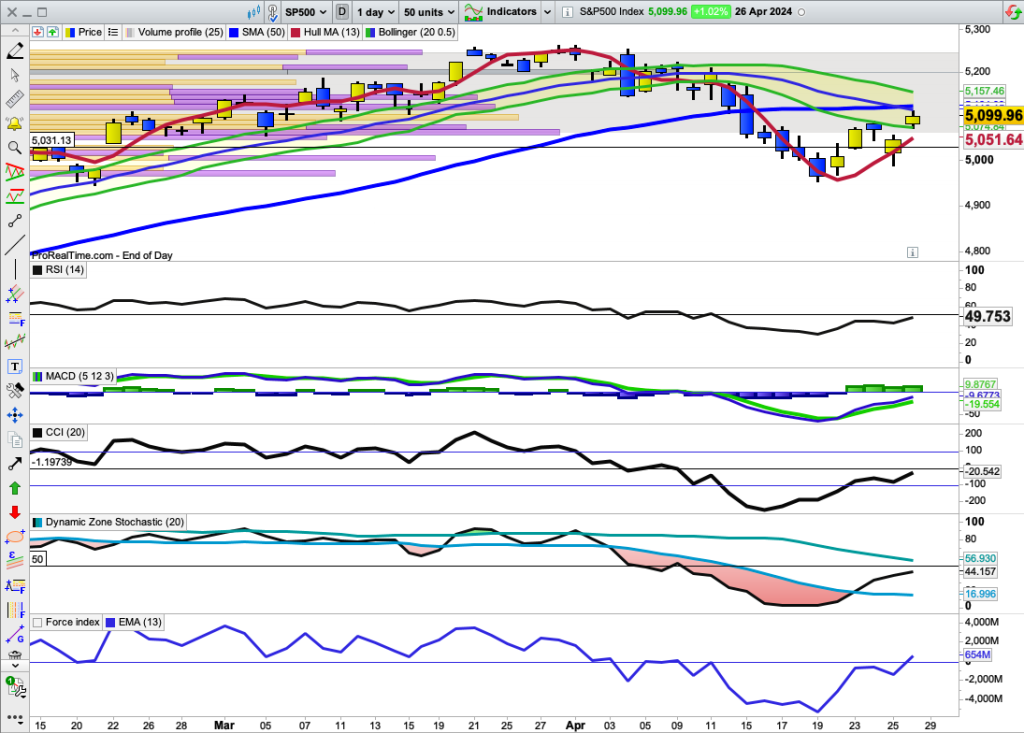
SP500
Despite the good rise this week, SP500 now faces a technical challenge similar to that of the XJO.
SP500 has risen to the confluence of the 30-Day MA and the 50-Day MA. It if fails here on Monday, then we can expect more downside.
If SP500 breaks above those two MAs, then the recent down side correction is probably over.
I have five indicators below the main chart. Four out of the five remain below their important mid-lines or zero lines, i.e., on the bearish side. Only the Force
Index has managed a small break above its zero line.
A solid rise by the SP500 will take all indicators above their dividing lines between bullish and bearish.
The odds currently favour the downside.
Sector Performance - last four weeks.The above graph shows the performance of the eleven ASX sectors + corporate bonds over the past four weeks.
The items are divided into three groups:
- Growth Group: Materials, Discretionary, Financials, Property.
- Sensitive Group: Telecommunications Services, Energy, Industrials, Information Technology.
- Defensive Group: Staples, Health, Utilities, Composite Bonds.
This is a handy way of showing the mind-set of Investors, particularly the large investors who determine the direction of the market.
- Cyclical Group, down -5.43%.
- Sensitive Group, down -5.08%
- Defensive Group, down -1.6%.
All groups are down, but the best relative performer is the Defensive Group -1.6%.
Until we see the Cyclical and Sensitive Groups out-performing the Defensive Group, the mind-set of Investors is definitely on the bearish side.
Stocks to follow.
Not all stocks lie in the bearish state. Some remain relatively bullish but are currently undergoing modest pull-backs. Watch these stocks to see if they bounce - which could lead to a tradable rally.
- ORG
- AWC
- NST
- Min
- WHC
- STO
Here's a chart for Origin (ORG)
Until Friday, ORG had closed above the 10-Day MA (light blue line) every day since 26 March.
On Friday, ORG was down and closed below the 10-Day MA and the Hull MA13 has turned down - a very short-term sell signal. ORG has been very strong and any pull-back is likely to be bought.
The above does not imply an immediate "buy" signal - just a set of stocks to watch which might buck the bearish mood of the market.
Do your own research on these stocks - don't take my word for it. They are offered as suggestions and as an educational posting.
Conclusion.
The ASX is currently in a bearish mood having failed comprehensively at the 50-Day MA. Over the past four weeks, the XJO has lost -4.06% and there is no sign as yet that the downside move is ready to end.
Bear Market Tactics:
- If RSI14 is above 60 - assume the market is overbought and will fall.
- If RSI14 is under 30 - assume the market is oversold, a bounce will probably occur and it will be a "bear trap". (RSI is currently at 39.28).
Good luck.
22/04 Indices, page-40


Add XJO (ASX) to my watchlist
 (20min delay) (20min delay)
|
|||||
|
Last
8,214.5 |
Change
-8.500(0.10%) |
Mkt cap ! n/a | |||
| Open | High | Low |
| 8,223.0 | 8,228.3 | 8,200.0 |
| XJO (ASX) Chart |