Id say we've hit a bottom of sorts. The monthly volume bars are showing theres been more buying over the last few months than ever. And id say its setting up for the next run. This is one highly shorted stock. 7.4% on nab IRESS as of today. It was 8% only days ago, so shorter are getting itchy.
The weekly chart has big resistance in this range, but with PM prices increasing would you want to short CHN or close out now?
This is all setting itself up like back in 2020 but the jump should be a lot more(look back on the chart, setting up for a repeat?). The volume is big atm. PM prices are increasing. Short Squeeze in coming?
On the daily chart, EMA's are setting up nicely. Yes not there yet but the EMAs are looking primed.
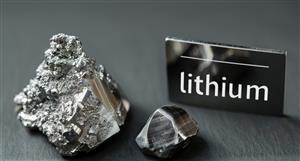
A golden cross in the making.? (CHN is so oversold, great resource, no funding needed and JV partner TBA imminently).
Chart isnt strictly a BUY now but when this runs it will run.
CHN chart, page-8015


Add CHN (ASX) to my watchlist
 (20min delay) (20min delay)
|
|||||
|
Last
$1.63 |
Change
0.015(0.93%) |
Mkt cap ! $632.1M | |||
| Open | High | Low | Value | Volume |
| $1.60 | $1.65 | $1.55 | $4.308M | 2.691M |
Buyers (Bids)
| No. | Vol. | Price($) |
|---|---|---|
| 1 | 3100 | $1.62 |
Sellers (Offers)
| Price($) | Vol. | No. |
|---|---|---|
| $1.64 | 9729 | 1 |
View Market Depth
| Last trade - 16.10pm 16/10/2024 (20 minute delay) ? |
| CHN (ASX) Chart |