Here are some examples of indexes with 6hr charts using 9,3,3 stochastic and 10, 20, 30 EMA's
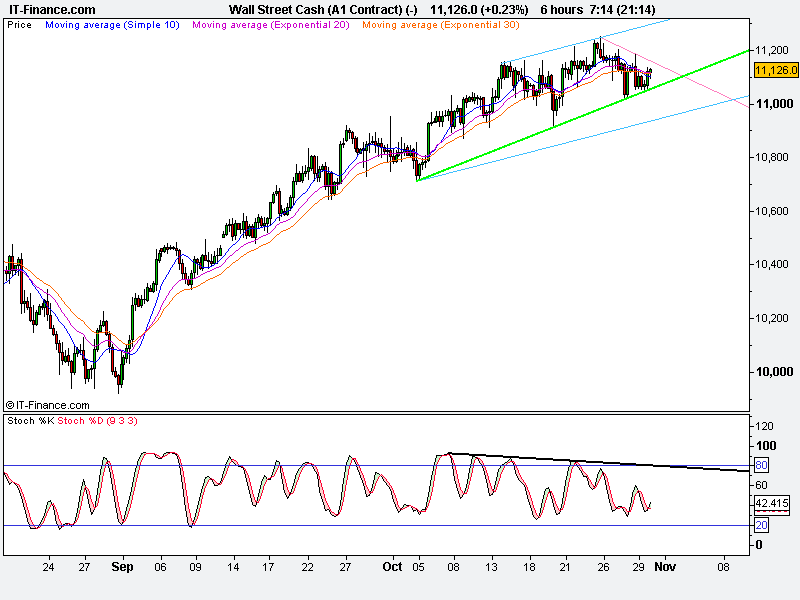
The 6hr Dow Jones Cash shows the relentless rise from below 10,000. But for the first time since the rally, the 10ema has crossed below the 30ema.
I know it's a 6hr chart and not a daily chart but it is an early warning.
Divergence is brewing on the stochastic and the green line has been strong support so far.
It is the line I am watching most closely as it has bounced off it during each of the last two sessions.
Keep in mind the FOMC meeting on Wednesday night for the Fed's QE intentions.
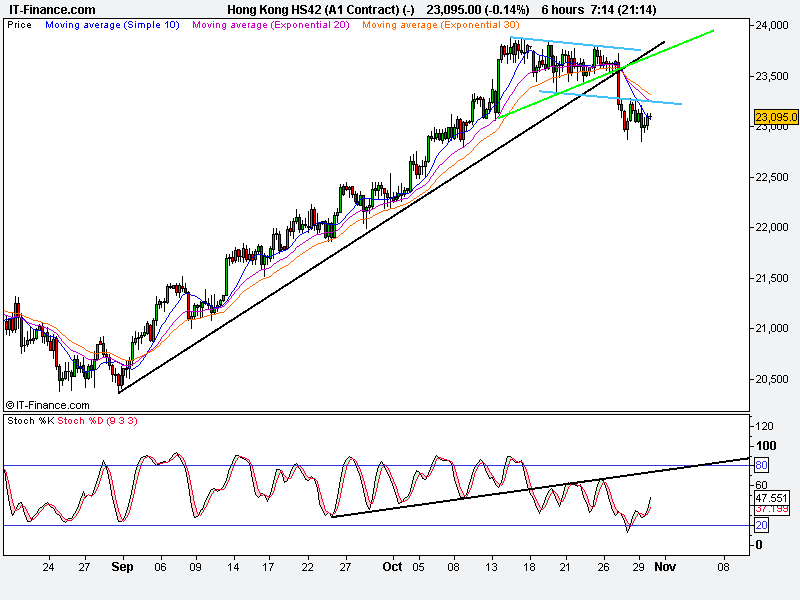
Now look at what happened to the Hang Seng when the chart was looking similar.
Look at the intersection of the green line, the black line, and the EMA bow tie once the stochastic line was backtested.
If HK leads then we're in trouble.
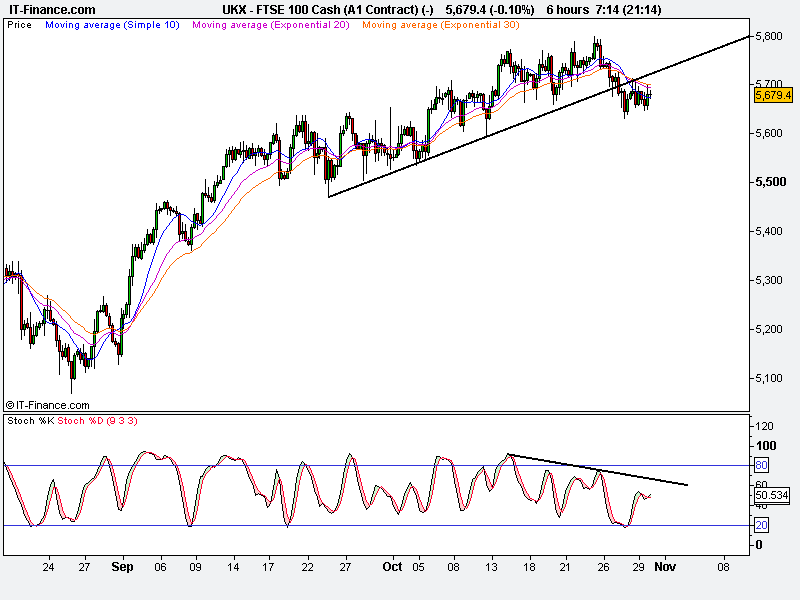
The FTSE showing divergence and a bearish EMA cross and the broken support being backtested as resistance.
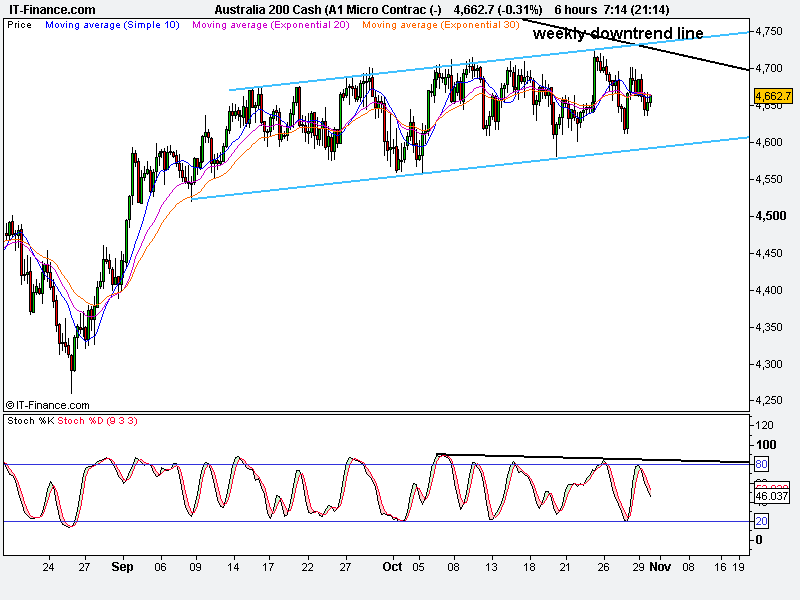
XJO where it is clear to see that we have lagged the rest of the world and support at 4600.
- Forums
- Charts
- weekend charting end of october!


