Thanks gj, but have to admit it was a fairly sloppy chart. Can't really get clear resolution of a weekly over ten years. The vertical lines are my guess of where the first week of dec is each year so I can line up the indicators below. I don't think prt can do a sequence of lines at a chosen interval, would be handy. I use yellow blobs as an important tool, just joking, usually just to highlight some pattern or other. Perhaps a monthly like the following would be clearer but then there is not much new in it.
Also looking at wheat, is it time to look at a short?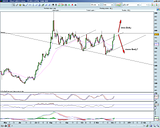
weekend charting 04122010, page-64


Featured News
Featured News
The Watchlist
WCE
WEST COAST SILVER LIMITED
Bruce Garlick, Executive Chairman
Bruce Garlick
Executive Chairman
Previous Video
Next Video
SPONSORED BY The Market Online