gj, firstly congrats that your looking at that often overlooked component
secondly and I realise that it's most probably your first attempt but that downtrend line as you have drawn in means nil :) sorry don't mean to sound harsh
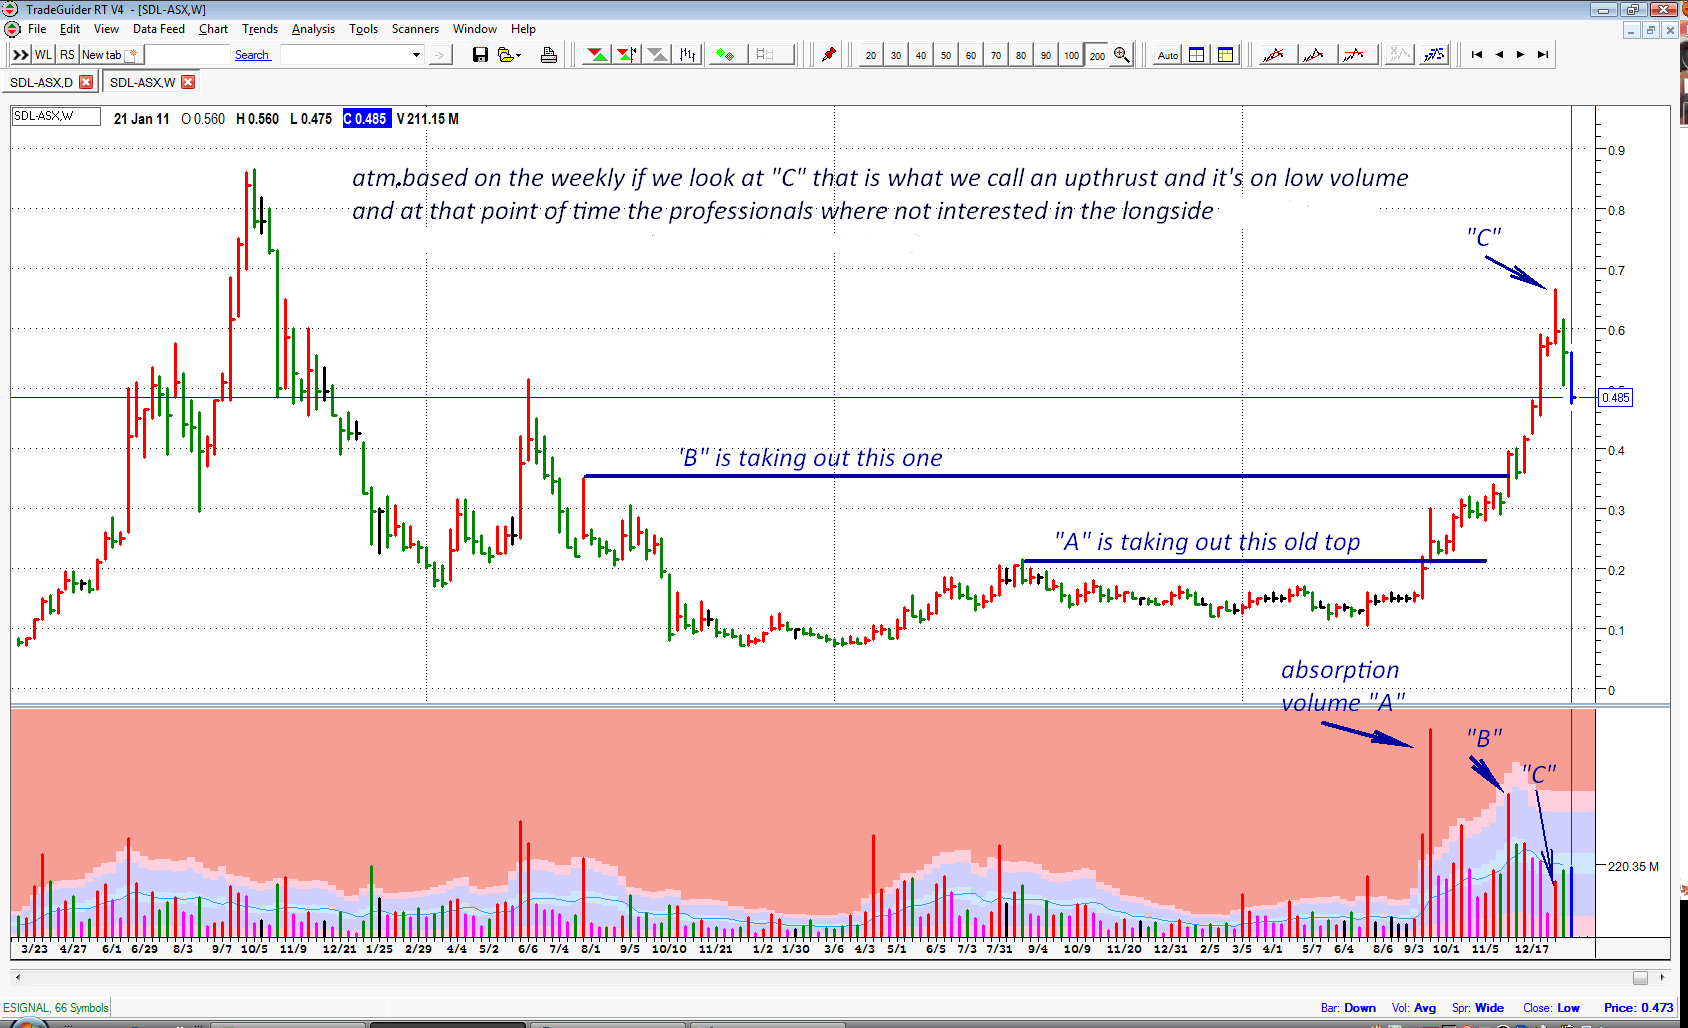
I've included a really simple chart and labeled 3points on it that touch 3volume bars on your downtrend line,
I've labeled them A,B and C. A and B is absorption volume which is good volume, that's where their buying there way thru old tops or ranges cause their bullish at that point,
but of course it's rings alarms bells with us because of the high volume, it may be hidden selling and weakness could be just around the corner, but we don't know that and the only way we do is wait to see if it is tested.
The third point, C, is an upthrust which is weakness and is not them selling but is the herd trying to buy by themselves so there is our dilemma, can we rightfully connect all of your 3 highs on those volume tops and come to a conclusion, ie. 2good, 1bad :) ???
P.S. gj, please ignore most of the above remember it's Sunday arvo but what we have remember is firstly whatever timeframe your working in, I find it better to try and work out if their selling or buying in a timeframe that's one timeframe smaller than the one I'm working in, hope this helps :)