dgorranson
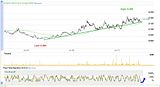
thanks for posting the RED chart.
i like to see other's perspective on charts.
i don't have any fancy charting package but this is what i see:
1. Sitting on Long term up trend
2. sitting just above 200 day sma
3. Stochastics in oversold area