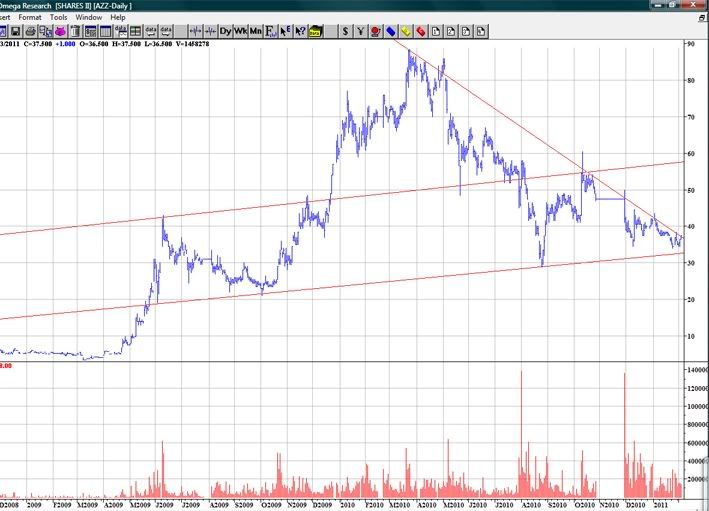
Ok since posts have degraded down to bickering I firgure its time to see Technically where we are.:) I zoomed back a here for the bigger picture. First thing that hits me is that lovely head and shoulders pattern (usually found at the end of a bull run, the formation of the second shoulder a confirmation of bearish times ahead.) A Tech trader wouldnt buy into this chart. In more recent days we have formed a large downward triangle, (downward sloping not usually a good sign), to break this trend a clean and sustained break of the upper line would be required, (say to 40c on increased volume for more than 3 days). I try to read charts as unbiased as possible but got to admit disillusionment has set in a little with this one. Any Tech people out there with a positive spin on it??

Add to My Watchlist
What is My Watchlist?


