DRA 2.37% $1.95 dra global limited

dra and some of its peers

  1. 982 Posts.
    lightbulb Created with Sketch. 25
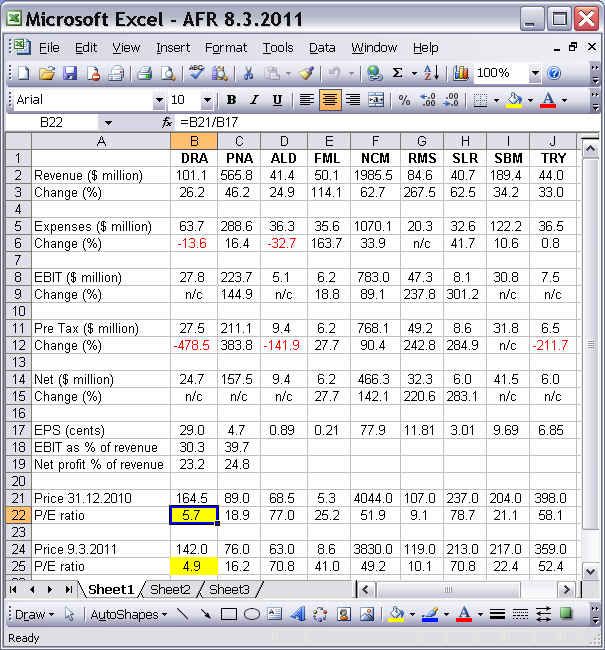
    Below is a table of profit numbers published in the AFR last Tuesday.
    DRA and PNA are Preliminary Final Reports.
    All others are Interim Reports.
    The P/E numbers are my calculations and are trailing P/Es.
    The DRA P/E number at end of 2010 was 5.7. It's now 4.9.
    You could conclude the manipulation efforts demonstrate a devaluation of 14% (4.9/5.7) amid a backdrop of rising PoG and increasing resource statements.
 
watchlist Created with Sketch. Add DRA (ASX) to my watchlist
(20min delay)
Last
$1.95
Change
0.045(2.37%)
Mkt cap ! $107.8M
Open High Low Value Volume
$1.94 $1.95 $1.94 $51.36K 26.46K

Buyers (Bids)

No. Vol. Price($)
1 1110 $1.95
 

Sellers (Offers)

Price($) Vol. No.
$2.03 5933 3
View Market Depth
Last trade - 16.10pm 01/11/2024 (20 minute delay) ?
DRA (ASX) Chart
arrow-down-2 Created with Sketch. arrow-down-2 Created with Sketch.