Thought I'd start a new thread for the chart stuff - can we keep this one just for charts? - hard to find everyones chart input amongst the other commentary.
I have a breakout on my daily and weekly. On the daily it has broken out from Dec highs so many times I have been using NOV highs which have contained price till now. - it isn't huge so open to interpretation of course from where you start your resistance lines from but money flow and stochastics confirm for me.
On the weekly we are looking even better - but weekly would normally lag daily so have watched for daily breakout closely. The weekly from November highs yet to break but v.close. Next week?
Anyway here's my latest scribbles for those interested.
Daily:
Weekly: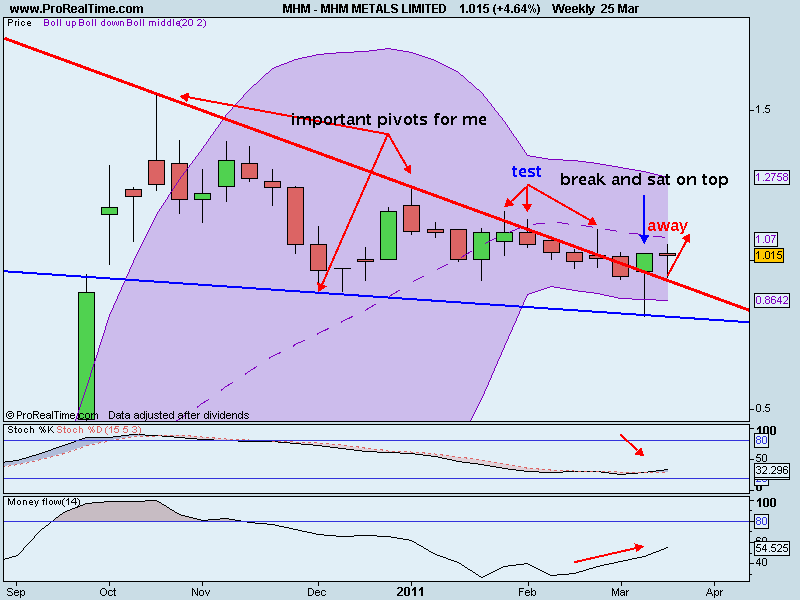
chart


Add VYS (ASX) to my watchlist
 (20min delay) (20min delay)
|
|||||
|
Last
31.0¢ |
Change
0.025(8.77%) |
Mkt cap ! $129.7M | |||
| Open | High | Low | Value | Volume |
| 28.5¢ | 31.0¢ | 28.5¢ | $281.3K | 940.2K |
Buyers (Bids)
| No. | Vol. | Price($) |
|---|---|---|
| 2 | 12336 | 30.5¢ |
Sellers (Offers)
| Price($) | Vol. | No. |
|---|---|---|
| 31.0¢ | 11996 | 1 |
View Market Depth
| Last trade - 16.10pm 08/07/2024 (20 minute delay) ? |
| VYS (ASX) Chart |