yesterday we looked at the 60 day copper chart. Today I am taking a broader look at the 6 month chart. Copper is looking very head and shoulderish particular after last nights decent fall to the neckline. Copper has bounced a little today during our trading session so no valid H&S just yet. However if it does breaks down from here on volume then expect it to go to around $3.80ish. No doubt Paddington Bear's indicator will kick in and copper will take the market with it.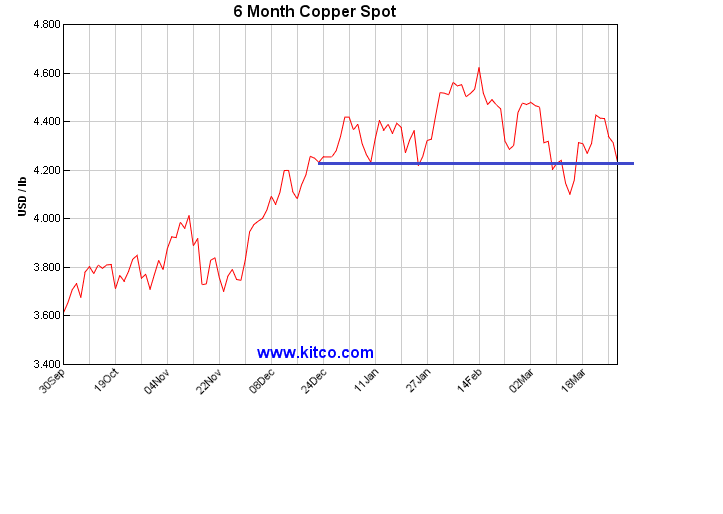
wave count=b up, page-42


Add XJO (ASX) to my watchlist
 (20min delay) (20min delay)
|
|||||
|
Last
8,027.0 |
Change
16.500(0.21%) |
Mkt cap ! n/a | |||
| Open | High | Low |
| 8,010.5 | 8,039.7 | 8,010.5 |
| XJO (ASX) Chart |