cyclichigh recently predicted the XJO low using a 1340 day count. I have been formulating this post for a couple of days now showing how that number is important also to the SPX. Many of my fibonacci time ideas are not new....in fact I have been banging on for nearly a year now about how I think may 21 for the XJO and June 13 for the US will be very significant. What is new today is :
1. I am highlighting from the US 2007 top until the armstrong low of June 13 will be 1340 days.
2. I have introduced the idea that the number 1340 is just as significant to price as it has been to time. IE SPX march 2009 low was 1340/2 and recent SPX high was approx 1340.
A little synchronicity occurred today. I watched the video of a former popular HC poster and he was showing the possibilities of either a high or low around my dates. He was highlighting the importance of the number 670 days in all this....which of course is 1340/2. I thought "LOL, you bleep, you stole my thunder".....so just remember that this little star gazer has been whomping on about these dates for the last year. But seriously, I also concede that a high is possible around my target dates and that it is only the Armstrong low that makes me favour the low. Although market turns don't always show up around Armstrong turns sometime they do. For instance the Nikkei peaked in 2007 2 days after the Armstrong 8.6 year peak.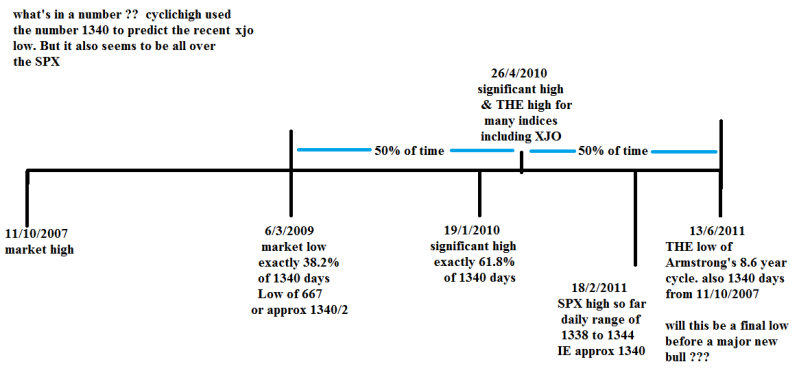
aussie on top friday, page-3


Add XJO (ASX) to my watchlist
 (20min delay) (20min delay)
|
|||||
|
Last
8,214.5 |
Change
-8.500(0.10%) |
Mkt cap ! n/a | |||
| Open | High | Low |
| 8,223.0 | 8,228.3 | 8,200.0 |
| XJO (ASX) Chart |