Pardon the late response Functi0n
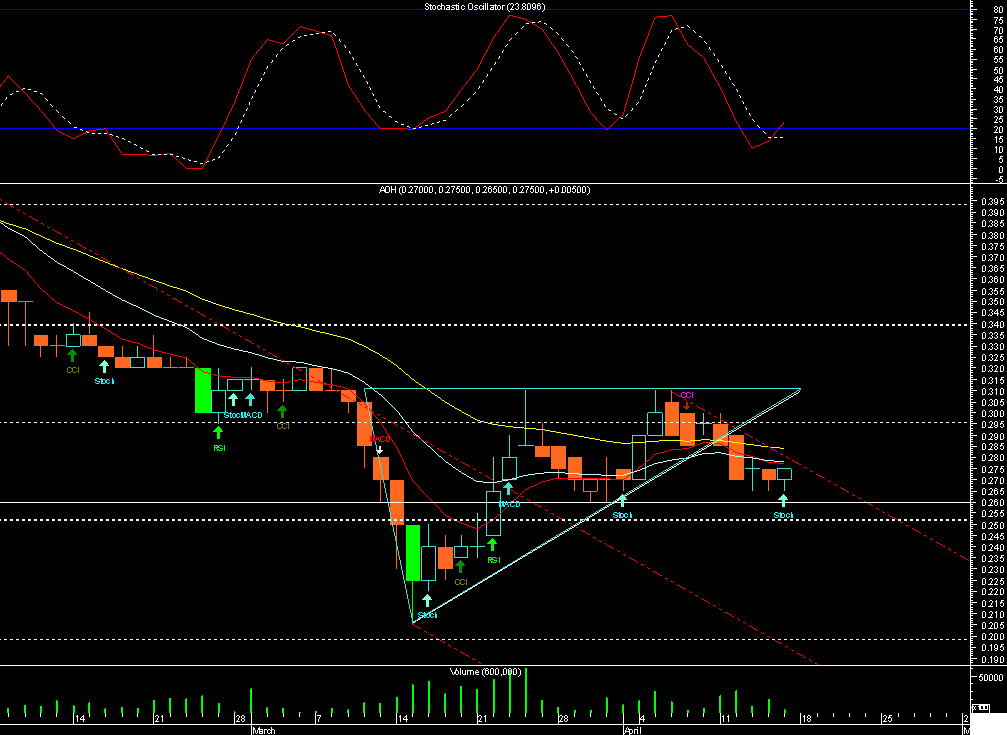
No.. There are a number of prerequisites for the C and H, the main one being that it must occur in an uptrend, So what you basically get is a triple top breakout into blue sky with the cup depth being the first target.. Its a common misconception that these things can occur at any time. With AOH the last chart pattern we observed was the ascending triangle which failed to breakout.. It still leaves us with a rectangular pattern with the same high as resistance, I have also drawn the stochastic oscillator history which is self explanatory, It has assumed that we can close on .275 today to trigger the Buy crossover..Lets hope the dumper has eased up, as the buy depth has been back filling nicely from their recent sell levels...
- Forums
- ASX - By Stock
- AOH
- chart
chart, page-28
Featured News
Add AOH (ASX) to my watchlist
Currently unlisted public company.
The Watchlist
EQN
EQUINOX RESOURCES LIMITED.
Zac Komur, MD & CEO
Zac Komur
MD & CEO
SPONSORED BY The Market Online


