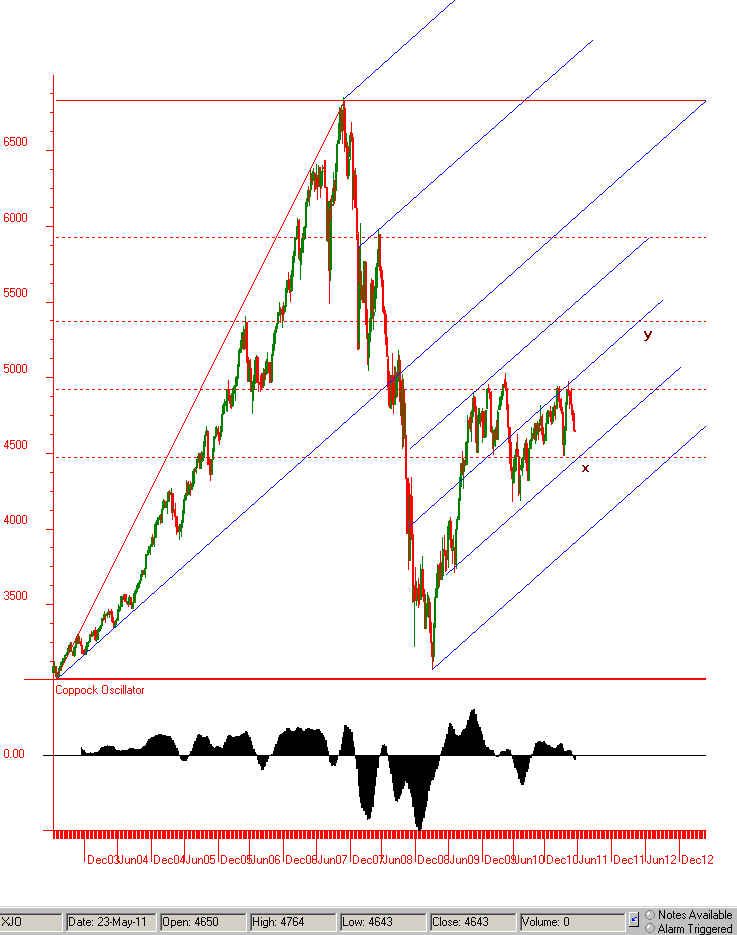
F&B, I like your stuff and here's a chart that points to a similar target zone at 'x'.
Acknowledgement: 'dgoranssen' posted a similar XJO structure about 10 days ago.
The internal parallels are hand drawn for guidance only and may not be millimetre perfect.(Mental note to set up prorealtime.) Coppock at bottom is there for no special reason but divergence is evident.
XJO
s&p/asx 200
Add to My Watchlist
0.32%
 !
8,773.5
timing by past inferences to present patterns, page-104
Featured News
Add to My Watchlist
What is My Watchlist?
A personalised tool to help users track selected stocks. Delivering real-time notifications on price updates, announcements, and performance stats on each to help make informed investment decisions.
 (20min delay) (20min delay)
|
|||||
|
Last
8,773.5 |
Change
28.300(0.32%) |
Mkt cap ! n/a | |||
| Open | High | Low |
| 8,745.2 | 8,821.0 | 8,745.2 |
Featured News
| XJO (ASX) Chart |


