UKid
Just looking at the chart there are a few basics that can be used as a guide. bollinger bands and support and since pen is trending down these are the areas to look at.
some support looks to be around 6c and where the bollinger sits as well.
of course long term support you can see sub 5c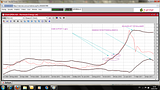
down , down down, page-68


Add PEN (ASX) to my watchlist
 (20min delay) (20min delay)
|
|||||
|
Last
10.5¢ |
Change
0.000(0.00%) |
Mkt cap ! $334.4M | |||
| Open | High | Low | Value | Volume |
| 0.0¢ | 0.0¢ | 0.0¢ | $0 | 0 |
Buyers (Bids)
| No. | Vol. | Price($) |
|---|---|---|
| 1 | 168504 | 13.0¢ |
Sellers (Offers)
| Price($) | Vol. | No. |
|---|---|---|
| 10.0¢ | 97307 | 6 |
View Market Depth
| Last trade - 10.01am 17/07/2024 (20 minute delay) ? |
| PEN (ASX) Chart |
Day chart unavailable