Valid Points - Things to note!
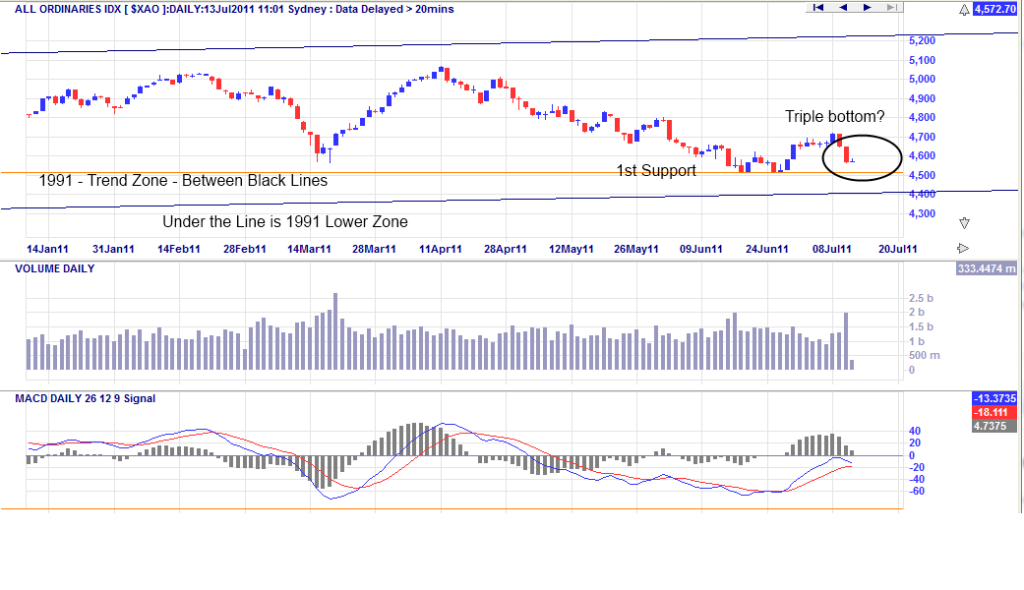
The 1991 yearly trend is still in place, we still have not even had a triple bottom on the recent support. So its interesting that with all the doom and gloom nothing has crashed hard. See chart (Yearly - last 5 months with the 1991 zone applied across it)
- Forums
- ASX - By Stock
- XJO
- run run sky is falling
XJO
s&p/asx 200
Add to My Watchlist
1.37%
 !
8,757.2
run run sky is falling, page-3
Featured News
Add to My Watchlist
What is My Watchlist?
A personalised tool to help users track selected stocks. Delivering real-time notifications on price updates, announcements, and performance stats on each to help make informed investment decisions.
 (20min delay) (20min delay)
|
|||||
|
Last
8,757.2 |
Change
118.200(1.37%) |
Mkt cap ! n/a | |||
| Open | High | Low |
| 8,639.0 | 8,776.4 | 8,639.0 |
Featured News
| XJO (ASX) Chart |


