DXY hourly, and a classic case of the fundamentals coming out the charts first. Higher double bottom at calculated support followed by outside bar (longer green bar in the oval) finishing up at low level. If it keeps it up, the indices are a high probability of falling. If the US indices fall, we won't rally. Simple.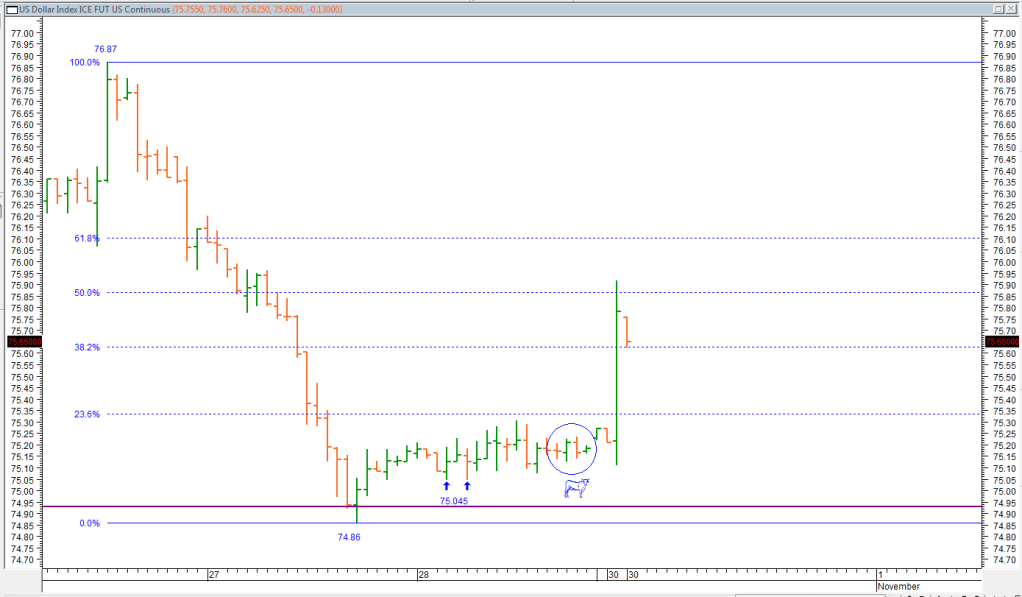


Add to My Watchlist
What is My Watchlist?
 (20min delay) (20min delay)
|
|||||
|
Last
8,757.2 |
Change
118.200(1.37%) |
Mkt cap ! n/a | |||
| Open | High | Low |
| 8,639.0 | 8,776.4 | 8,639.0 |
| XJO (ASX) Chart |