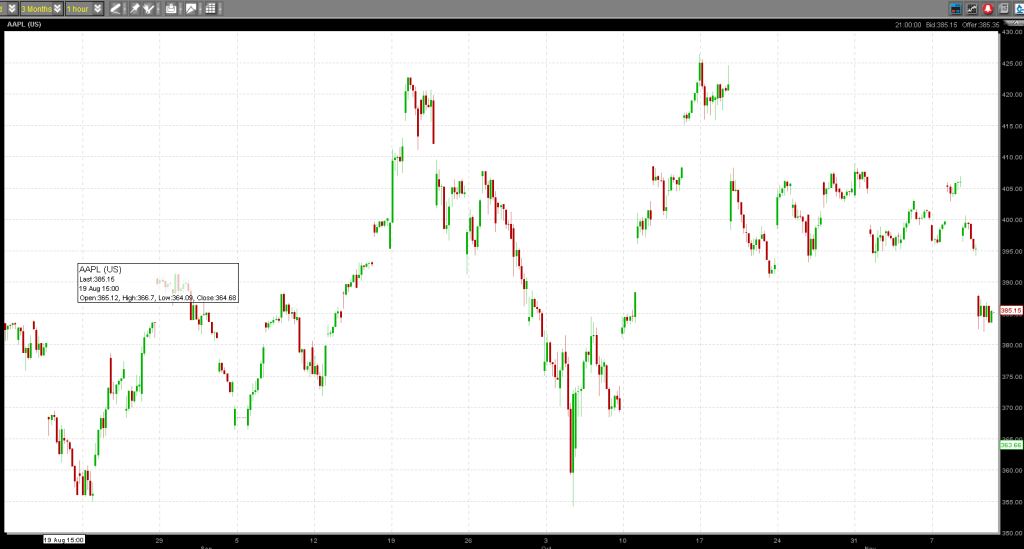
Here is the chart for Apple. I haven't done anything to is so you have to use imagine the lines are there. It may hold a key to unlock the future. It looks like it has spent a three or so weeks distributing after the mid October high, with a slightly upward tilting wedge. Can the oil stocks take us to new highs from here?
- Forums
- ASX - By Stock
- XJO
- chris fords rambo friday - 11/11/11
chris fords rambo friday - 11/11/11, page-89
-
- There are more pages in this discussion • 26 more messages in this thread...
This thread is closed.
You may not reply to this discussion at this time.
You’re viewing a single post only. To view the entire thread just sign in or Join Now (FREE)
Featured News
Add XJO (ASX) to my watchlist
 (20min delay) (20min delay)
|
|||||
|
Last
8,428.9 |
Change
128.700(1.55%) |
Mkt cap ! n/a | |||
| Open | High | Low |
| 8,300.2 | 8,429.6 | 8,300.2 |
Featured News
| XJO (ASX) Chart |


