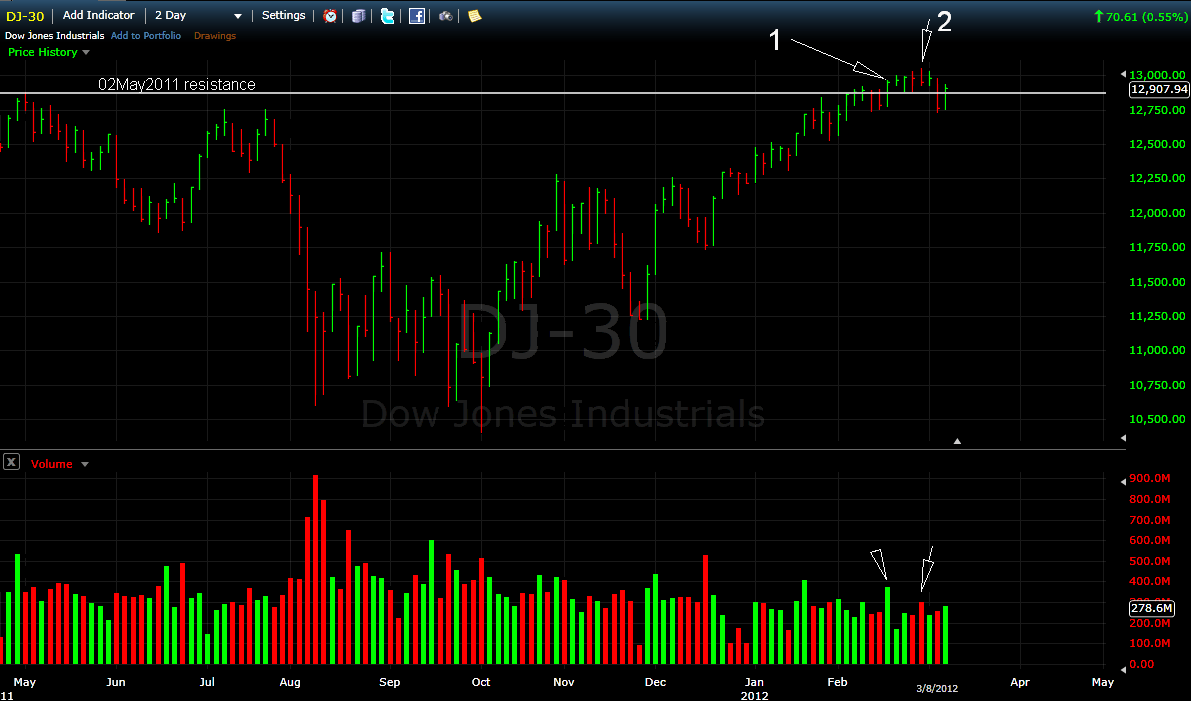
Last nights volume on the DJIA wasn't too impressive but if we roll it into a 2day chart this is what it looks like
Looking back to (1) it pops its head above that old resistance level with an increase volume/spread but then moving over to (2)
which has an increase in volume and is an upthrust containing supply followed immediately by a NO DEMAND bar
Then breaks lower under the RL but with the last bars action, up on an increase in volume, like a 2bar reversal with its head above the resistance once again
Will be very interesting if there is follow thru with their Fridays action, that will be the key in the ST
- Forums
- ASX - By Stock
- XJO
- gjunter's fustercluck friday
gjunter's fustercluck friday, page-26
Featured News
Add XJO (ASX) to my watchlist
 (20min delay) (20min delay)
|
|||||
|
Last
8,285.2 |
Change
61.200(0.74%) |
Mkt cap ! n/a | |||
| Open | High | Low |
| 8,224.0 | 8,285.2 | 8,224.0 |
Featured News
| XJO (ASX) Chart |
The Watchlist
BTH
BIGTINCAN HOLDINGS LIMITED
David Keane, Co-Founder & CEO
David Keane
Co-Founder & CEO
Previous Video
Next Video
SPONSORED BY The Market Online


