
XJO Monthly Chart
The long term chart of XJO has been range bound all year - no trend.
In September, XJO has fallen -2.03%.
This is a market for traders - long term investors wait.
XJO Weekly Chart.
This week, the ASX was down heavily, -1.67%
The MACD Histogram in the bottom panel shows little sign of varying from the zero line, i.e., the Index remains range bound.
STW Daily Chart. (STW is a tracking ETF for the XJO)
Above is a Candle Volume chart for STW. The big advantage of a Candle Volume chart is that the width of the candle shows the volume traded that day. That's important information which a regular candle stick chart doesn't show.
The current pull-back has been accompanied by low volume after hitting the top of the Value Zone of the Volume Profile (horizontal bars to the left of the chart).
Low volume on a pull-back suggests the pull-back won't last.
Sector Performances this week.
Ten out of eleven sectors were down this week. The only positive - Energy (XEJ) +0.6%. Financials were flat, -0.2%, a relatively insignificant fall.All other sectors were down >1%. Materials (XMJ), heavily weighted to miners, was the worst -2.98%.
XMJ Weekly Chart.
XMJ is back down to a major horizontal support level. If recent history is repeated, we should see a move to the upside.
Of course, we are now into the "danger" months of September and October. Downside moves are often seen in these months.
A break lower through horizontal support - then all bets (except bearish ones) are off.
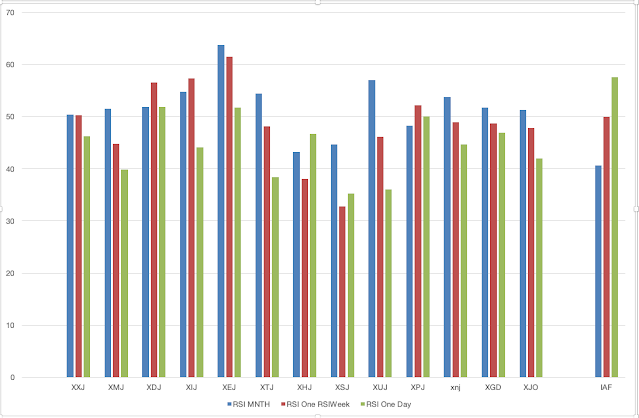
Momentum.
I use RSI from three different time scales to measure relative changes in momentum: monthly, weekly and daily.
Using this, I sort Sectors into Bullish (columns slope up), Bearish (columns slope down), Pull-back (up then down) and Counter-trend rally (down then up).
Bullish: No sectors are showing bullish momentum. IAF (over on the left) is a composite bond ETF - and is showing bullish. Bonds are a "safe haven" when the market is negative.
Bearish: Financials, Materials, Energy, Telecomunications Services, Utilities, Industrials, Gold, ASX200.
Counter-trend Rally: Health, Staples.
Pull-back: Discretionary, Information Technology, Property,
It's probably best to avoid stocks in the Bearish Sectors, and look for opportunities in the Bullish, Pull-back and Counter-trend Rally Sectors.
Energy is an interesting case. Its monthly column is the strongest for all the sectors - so long-term it has been very strong. Its weekly column is the strongest of all the sectors. Its daily column is the second strongest of all the sectors. But the three columns slope downward, so it has been falling for some time.
I wouldn't count Energy out on the basis of its bearish profile.
100 Leader Stocks above their 200-Day, 50-Day and 10-Day Moving Averages.
Above their 200-DMA: last week 48%, this week 43%.Above their 50-DMA: last week 50%, this week 40%
Above their 10-DMA: last week 67%, this week 25%.
These figures reflect the fall in the Oz market this week. The "Stocks above 10-DMA" is now back down to a low level - so we could see a bounce here.
Strong Stocks - Weak StocksThis week, Strong Stocks 2, Weak Stocks 29. Net -27. We haven't seen readings as poor as those since the end of October, 2022.
Conclusion.
The Australian stock market has been range bound for many weeks.
We are now into the weakest months of the year, so a break lower from the range is a possibility on the basis of historical seasonalities.
Central Banks, however, seem to be in a pause phase of interest rate rises, so that might provide some impetus for a move to the upside.
I'm agnostic at the moment about where the market might head - but the market will show its hand.
04/09 Indices, page-198


Add XJO (ASX) to my watchlist
 (20min delay) (20min delay)
|
|||||
|
Last
7,959.3 |
Change
69.700(0.88%) |
Mkt cap ! n/a | |||
| Open | High | Low |
| 7,889.6 | 7,969.1 | 7,889.0 |
| XJO (ASX) Chart |