Hi Bones,
Thanks for the chart. I too love my charts but know very little about pitch fork theory.
I personally would find it difficult to use a chart for trading patterns with BRM as I'm pretty convinced that the share price is heavily manipulated with few true buyers/sellers.
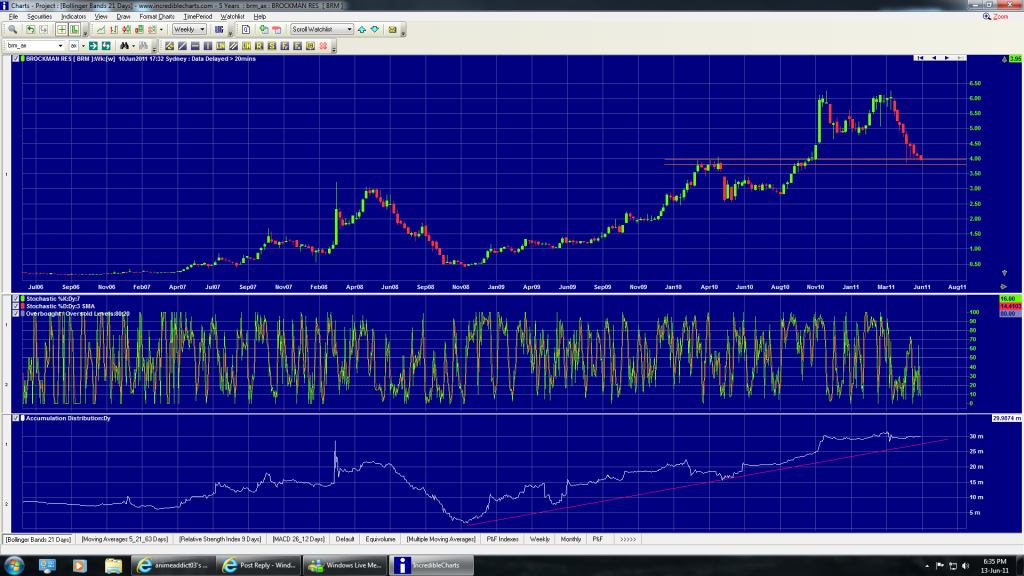
I find it a little bearish that the sp has closed below $4 as this has been good support in the past. The weekly chart is also the worst its ever been with a consecutive 9 weeks of closing lower. $3.80 - $4.00 is also shown as support though.
The RSI is improving though although it is still below 50.
Long term uptrend is still intact but the next couple of weeks will be interesting to see if that stays intact. The P&F chart also shows a intact channel imo.
My favorite chart has always been the Acc/Dis.
The share price falling whilst the Acc/Dis is exactly the same indicates to me accumulation on the sly. Thats the most positive aspect for me.
I cant help but agree with Mozart though...what is going to drive the sp UP from here though??
Goodluck all.

Add to My Watchlist
What is My Watchlist?


