
Weekly Wrap - Week ending 15 April, 2022.
XJO Monthly Chart.
March was a good month for the XJO, up +6.39%. April has begun with a consolidation period, after two weeks it is up just +0.32%%. 8-Month EMA and Hull MA13 have both turned bullish. It's early days in the month of April, so we need more time to see if this bullish bias can hold for the rest of the month. At this stage, it is looking promising.Weekly Chart.
XJO was positive this week, +0.61%. That maintains the medium-term bullish trend.It remains above the 8-Week EMA, Supertrend (1.5/7) and Hull Moving Average remain bullish. Any pull-back is likely to be bought.Daily Chart.
By the end of this week, XJO strengthened with the 8-Day EMA and Hull MA13 both turning short-term bullish. The Supertrend (1.5/7) may be indicating a resistance level.
Using multiple time-frame analysis, Monthly and Weekly XJO remain bullish. Daily XJO has also now turned bullish. This is now a risk-on market.
Relative Strength of Sectors - past 52 days.
This chart compares the performance of each sector against the performance of the XJO. Sectors above zero have outperformed the XJO over the past 52 days. Sectors below zero have underperformed XJO over the past 52 days. Eight Sectors were up this week and three down. Gold (an Industry Group part of Materials) has had an exceptional week.As a general rule, look for stocks in the best sectors and avoid stocks in the worst sectors. For example, look to Utilities (XUJ), Energy (XEJ) and Materials (XMJ) for stocks to buy. Avoid Consumer Discretionary (XDJ), Information Technology (XIJ) and Property (XPJ). (Exceptions to that general rule could occur.) XUJ is now very overbought and probably not a serious contender for current buying - look to buy the dip.New Highs - New Lows Cumulative.NH-NL Cumulative is in a consolidation phase and has just tipped under its 10-Day Moving Average, that's a caution sign for long-term investors. Further deterioration should be taken seriously.% of Stocks above key moving averages.1. % of stocks above 10-Day Moving Average, 52%.2. % of stocks above 50-Day Moving Average, 69%.3. % of stocks above 200-Day Moving Average, 56%.All three are above 50% level - that confirms the risk-on status of the market.Bonds versus Stocks.
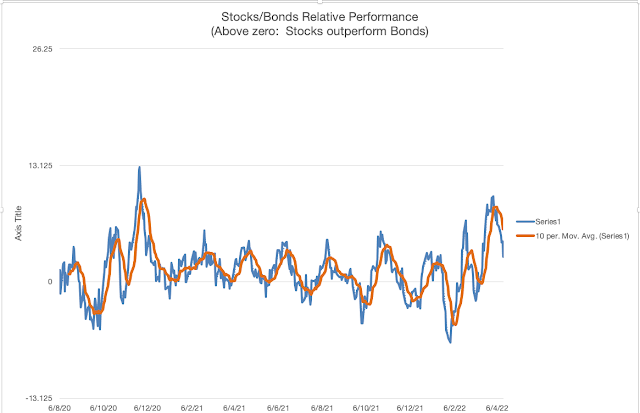
At the end of the week, Stocks had a clear advantage over Bonds.The relativity has weakened a little with the chart now below its 10-Day MA. That's not necessarily a bearish signal - it's just that bonds are doing a little better in the past few days than they have in recent times. Stocks are still the preferred option while the chart remains above zero.Strong Stocks versus Weak Stocks.Amongst the ASX100 stocks, I have 15 strong stocks and 10 weak stocks. That still provides a bullish bias to the market. But the number of weak stocks has steadily increased over the past four weeks. Five weeks ago they stood at zero, now they are up to fifteen. The market is becoming a little unbalanced, not dangerously - but we may be seeing some big internal shifts in the market.Eleven of the fifteen strong stocks came from Materials and Energy. Add to that two from Utilities, which tends to correlate with Energy, we can see just how unbalanced the market is becoming. A set-back for Materials and Energy could be a set back for the whole ASX. Stay vigilant.Conclusion.
The monthly, weekly and daily charts remain positive and in sync. While they remain in sync, we have a risk-on market.
Traders should concentrate on the strongest sectors: Utilities, Materials and Energy.
RB


Add to My Watchlist
What is My Watchlist?
 (20min delay) (20min delay)
|
|||||
|
Last
8,580.1 |
Change
-9.100(0.11%) |
Mkt cap ! n/a | |||
| Open | High | Low |
| 8,589.2 | 8,619.8 | 8,568.2 |
| XJO (ASX) Chart |