
Weekly Market Wrap for the ASX. Week ended 16/2/24
I recently wrote about the dangers of looming recessions. Since then, Britain and Japan have fallen into recession, and Germany is looking shaky.
Australia's unemployment rate has ticked up from 4% to 4.1% in January which sent jitters through the economy. Will a recession or a slower economy mean a lower stock market? Not necessarily, it might hasten an RBA to hasten an interest rate cut - which would be a positive for the market. It will all depend on how sharp the economy pulls back and how quickly the RBA responds. The RBE is notoriously slow to respond, but with a new Governor in Michelle Bullock, any assumptions about what the RBA might do remain open questions.
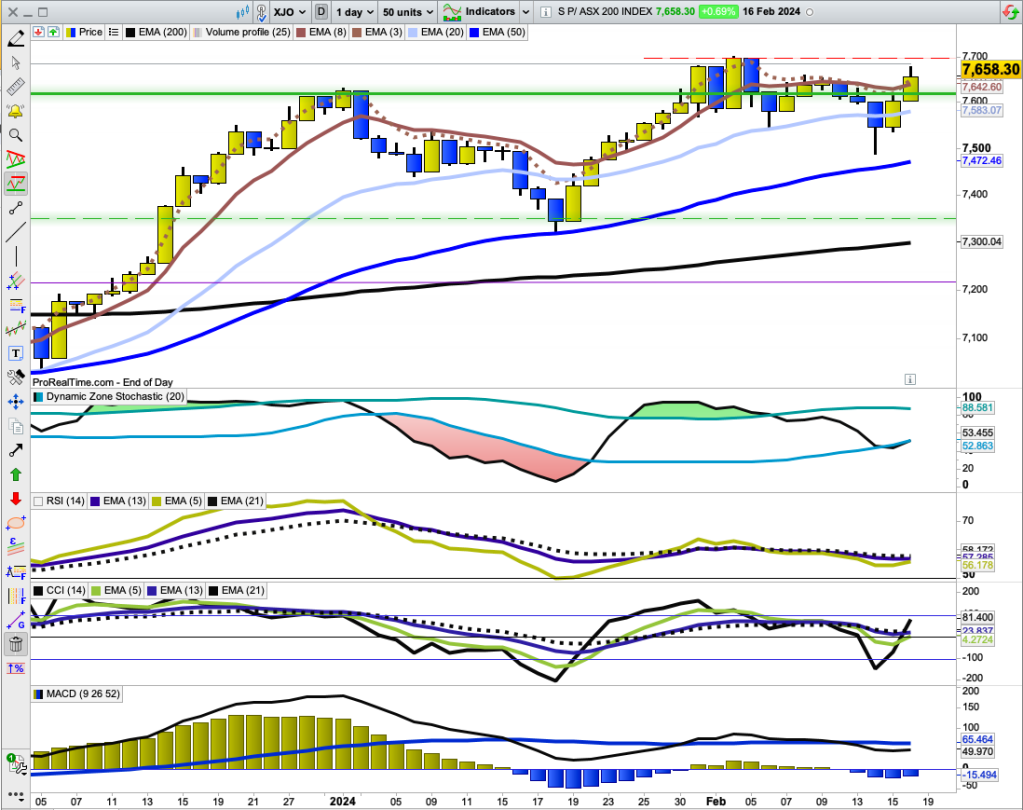
XJODaily Chart
XJO finished flat for the week, up just +0.18% after a sell-off early in the week. Thursday and Friday saw the index bounce off the 30-Day EMA but it remains below the high of 2 February. Until that high is broken to the upside, I'll call this a consolidation
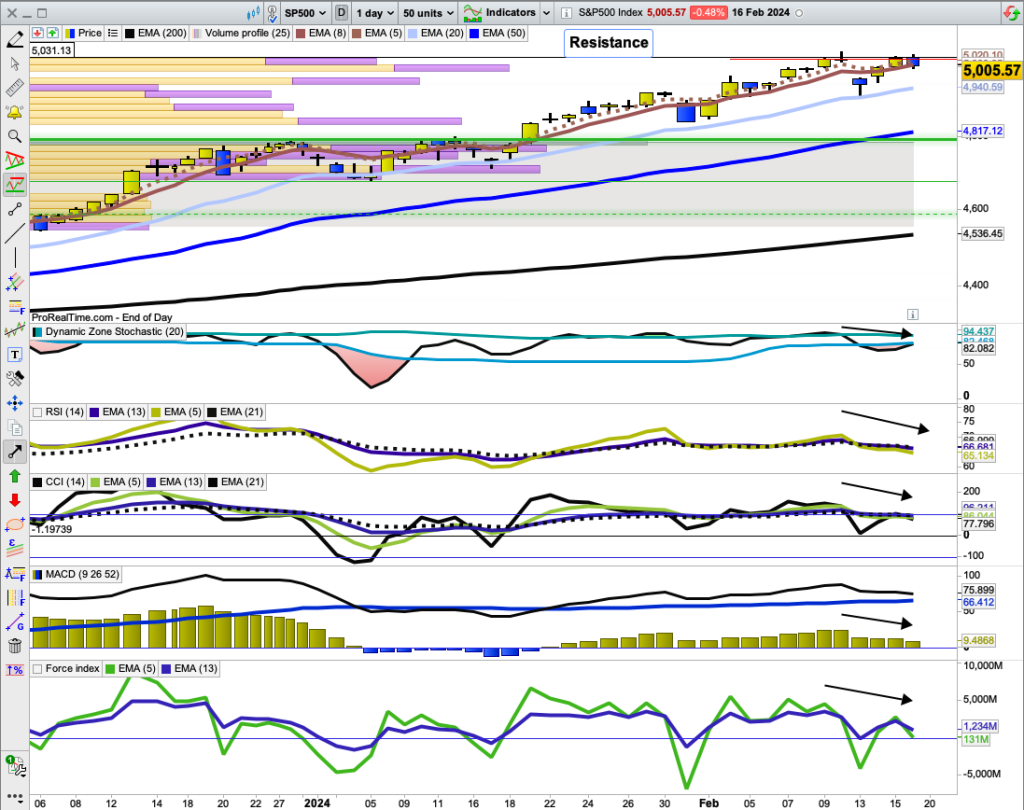
Daily SP500 ChartSP500 had a poor day on Friday, down -0.48%. It remains at resistance from 12 February. All indicators show negative divergences suggest that the next move will be down.
The last three times the SP500 has pulled back, buy-the-dippers have come into the market at the 20-Day EMA. There is no reason to suggest that this time will be any different.
Expect a short-term pull-back.
The Australian market has been weaker than the American market, but the 50-Day EMA has proven to be a solid support level for any pull-back in our market since November last year.
What's been happening this week and this month in the Australian Sectors.
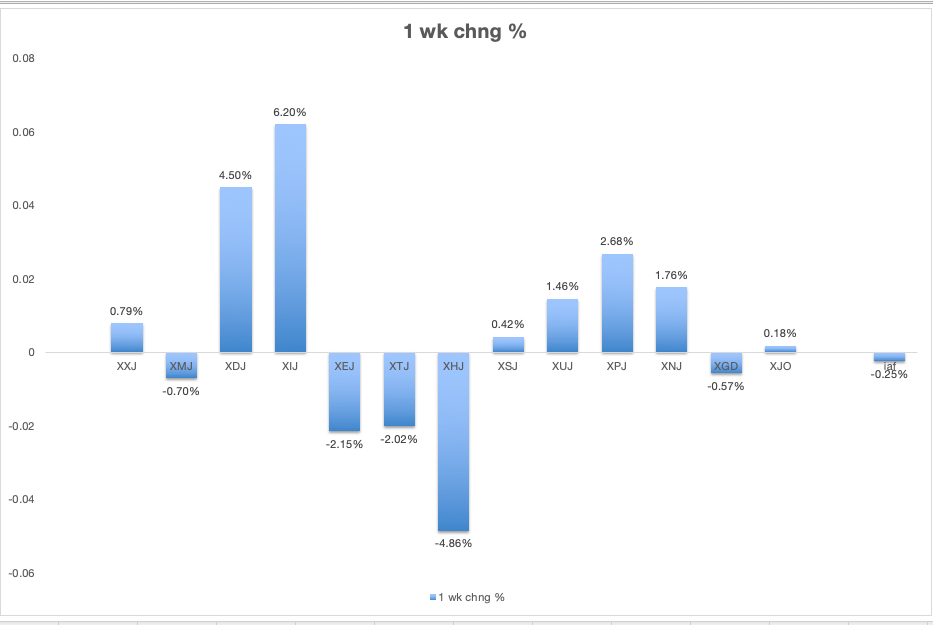
- Sector Changes this Week
It was a mixed week this week for ASX sectors. Seven up and four down. Gold Miners industry group (part of XMJ) was also down.
Best three were XIJ(Information Technology) +6.2%, XDJ (Discretionary) +4.5%% and XPJ (Property) up +2.68%. Those three sectors are from the Cyclical or Sensitive groups which suggests there is still plenty of confidence in this market.
Worst performer was XHJ (Health) after CSL, a large cap stock, fell heavily after reporting a poor result for a heart treatment it was developing. CSL was down -4.84% on Monday and a further -2.75% on Tuesday. It then hit the 200-Day EMA where it has stabilised.
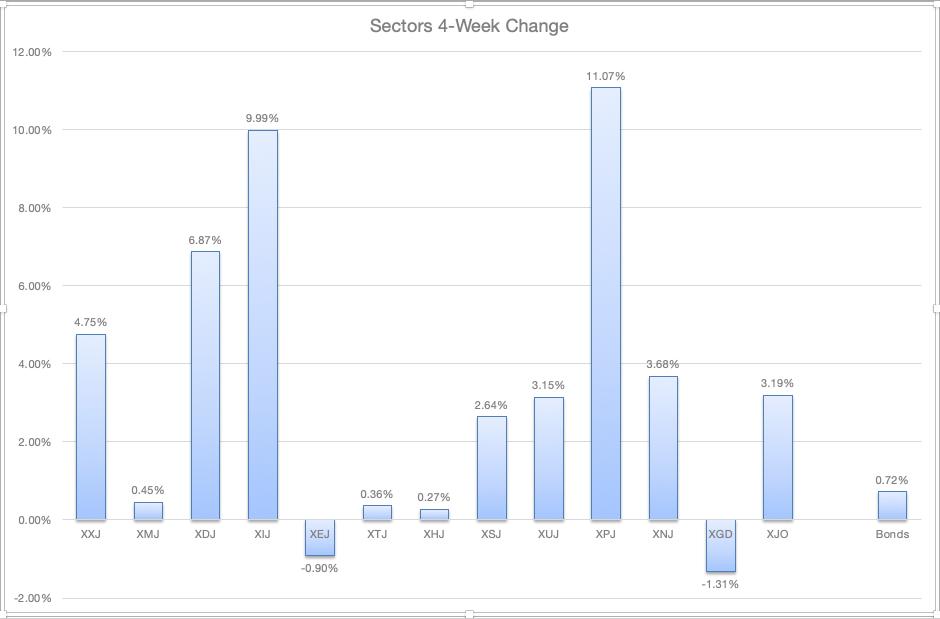
2. Sector Changes this month.
Comparing the Weekly Change with the 4-Weekly Change, we can see that XPJ (Property), XIJ (Information Technology) and XDJ (Discretionary) dominate the changes - and confirming the current one-week changes. Look to those three sectors for buying opportunities if a pull-back occurs.
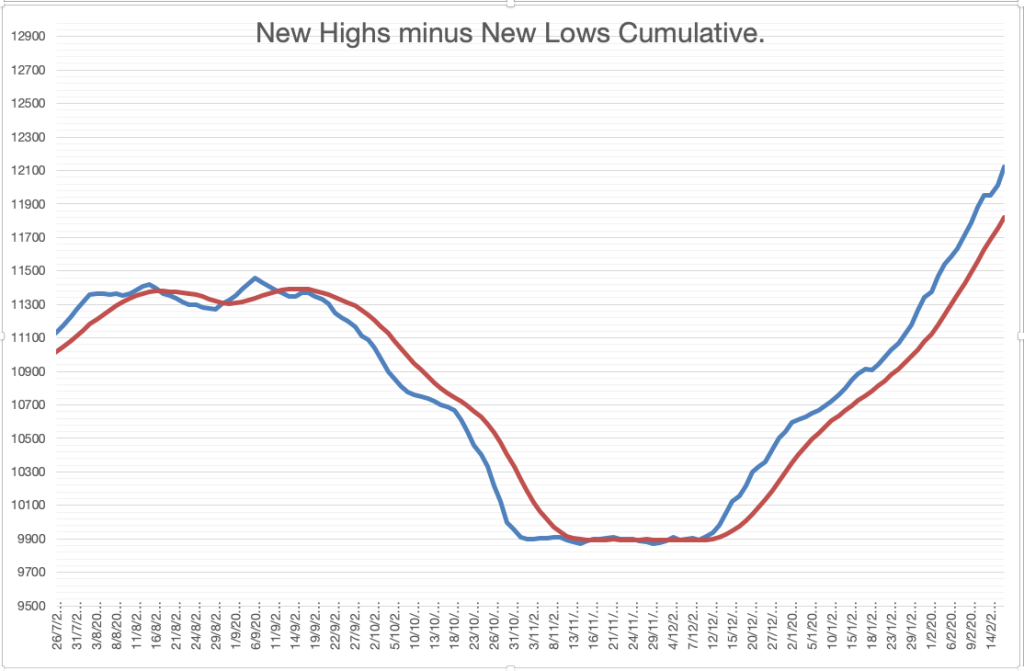
Long-Term Trend.Cumulative New Highs minus New Lows provides a handy guide to the long term trend for long term investors. It is currently headed up and above its 10-Day MA - bullish. Stay with the trend.
Roughie of the Week
Gold Miners (GDX) has been underperforming for some time. Volume studies this week suggest that GDX could be ready for a rally.This candle-volume chart shows bigger volumes entering GDX over the past three days which suggests the big money boys are betting that the current down trend is destined for some up-side. It's usually not a great idea to bet against the big money boys. Do your own research on this one. Don't take my word for it.
Conclusion.The Australian market seems likely to have a short-term pull-back. If recent history is any guide, any pull-back is likely to be bought.
Good luck.
Weekly Market Wrap for the ASX. Week ended 16/2/24I recently...


Add XJO (ASX) to my watchlist
 (20min delay) (20min delay)
|
|||||
|
Last
8,214.5 |
Change
-8.500(0.10%) |
Mkt cap ! n/a | |||
| Open | High | Low |
| 8,223.0 | 8,228.3 | 8,200.0 |
| XJO (ASX) Chart |