
The past week was negative for the Australian stock market, with big falls occurring on Thursday and Friday/
XJO Weekly Chart.
XJO down this week, -2.13%, erasing the gain from the previous week.XJO had no trouble slicing through important support at 6957 and finished at the equally important support of 6900 (round figures).
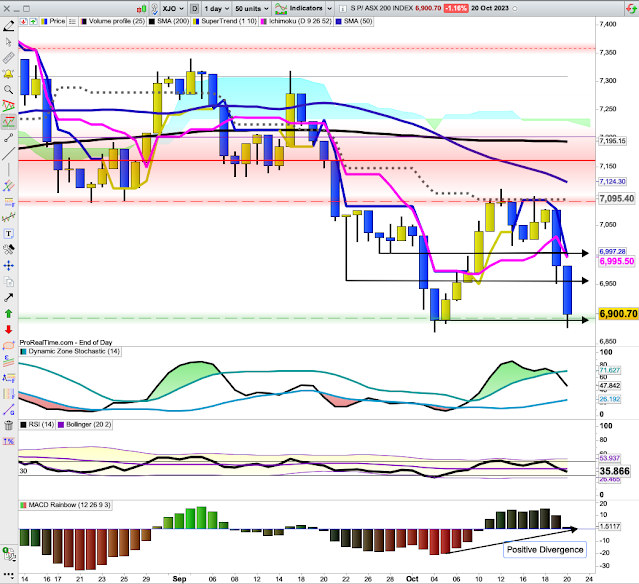
XJO Daily Chart.
XJO held up reasonably well for the first three days of the week, but sliced through important support t 7000 (round numbers) on Thursday. On Friday, it continued down through the next support at 6957 to finish at the next important support of 6900.
Positive divergence on the MACD Histogram suggests the next move will be to the upside.
SP500 Daily
SP500 is showing a similar pattern to the XJO. It is back down to an important support zone. It is also opposite a high volume node which might provide support.
MACD shows a positive divergence which suggests the next move will be to the upside.
SP500 was down -2.39% for the week. That was an unusual negative result as the past week was Options Expiry Week which has a positive bias.
Sector Performances this week.
The only places to be this week were XEJ (Energy) +2.67% and XGD (Gold Miners) +6.1%. Both were benefitting from a War premium due to the Hamas/Isreal Clash.
After Energy, best performing sector (relatively) was Materials (XMJ) down -1.57%, IT (Info. Tech) was down a whopping -5.07%. IT over the long term has a good growth record, but short term can be volatile. A great trading mechanism for savvy traders (as is Energy and Gold).From the time of the initial incursion by Hamas into Israel early in October, XGD (Gold Miners) is up more than +15%.100 Leader Stocks above their 200-Day, 50-Day and 10-Day Moving Averages.
The few times we've seen figures like those for ^10DMA were in early July '23, mid March '23 and late Sept. '22.
- Above their 200-DMA: last week 35%, this week 32%.
- Above their 50-DMA: last week 32%, this week 21%
- Above their 10-DMA: last week 72%, this week 19%.
I've marked those times on a weekly chart of XJO below:
The last three times we had an exceptionally low reading for Stocks ^10DMA. it has been followed by a tradable rally.Conclusion.The War in the Middle East has had a negative effect on stock markets, but Energy and Gold Miners have been beneficiaries.Technical analysis suggests the next movement in stocks will be to the upside, but we're in a dangerous period with War in the Middle East. So technical analysis might be thrown out the window.November tends to be a positive month for stocks.Finally, SPY (ETF for SP500) finished at $420.58. MAX PAIN for November Options Expiry for SPY is $450. That's a hefty premium of +7%.Good luck
The past week was negative for the Australian stock market,...


Add XJO (ASX) to my watchlist
 (20min delay) (20min delay)
|
|||||
|
Last
8,099.9 |
Change
24.200(0.30%) |
Mkt cap ! n/a | |||
| Open | High | Low |
| 8,075.7 | 8,143.6 | 8,075.7 |
| XJO (ASX) Chart |