
Every US bear market of the past 73 years ended when the S&P 500 retook and held above its 200-day moving average for at least 18 days, according to Sentiment Trader.
As of 19th July, the S&P 500 has been above the 200-DMA since 23 March (that’s around 80 trading days ago).
“Whenever this phenomenon has occurred, the market always rallied over the next three, six, and 12 months, with average 12-month returns of about 20%,” writes InvestorPlace.
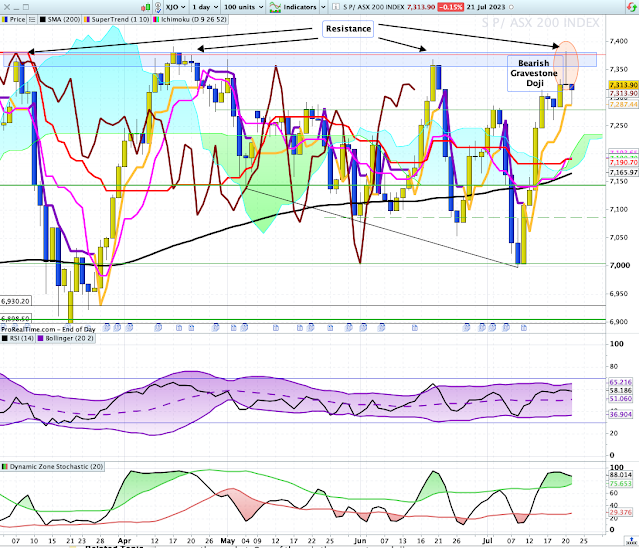
XJO Daily Chart.
On Thursday, XJO printed a very tall Gravestone Doji Candlestick. That's a bearish signal. It came at a major horizontal resistance, which gives the signal added significance. XJO retreated a little on Friday, down -0.15%. The Index can expect more downside. Watch for a break by the Dynamic Stochastic below its upper band to signal more downside.Horizontal support exists at 7279. XJO finished at 7314 on Friday. So that first level of support is not far away. If that fails, the next level of support seems to be the Kumo Cloud. That's a dynamic support level but currently sits around 7234. That is also not far away but could provide support - watch what happens around that level.XJO was up +0.15% for the week. Basically flat.How is the American SP500 doing?
SPX has been doing much better than the Australian XJO.
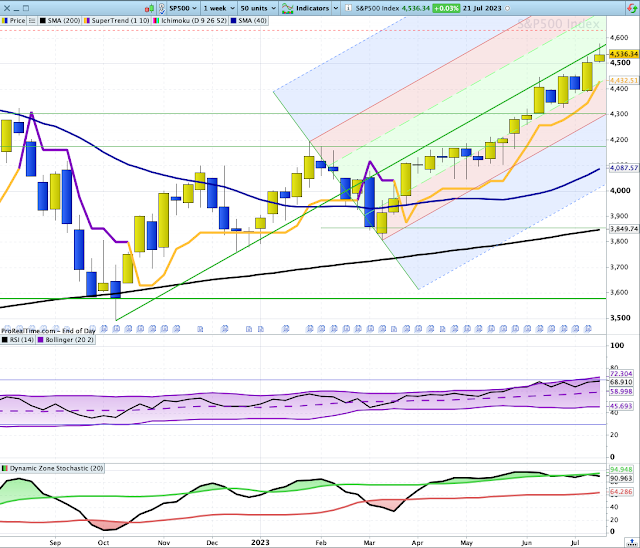
Below is a weekly chart of SPX with an Andrews' Pitchfork overlay.
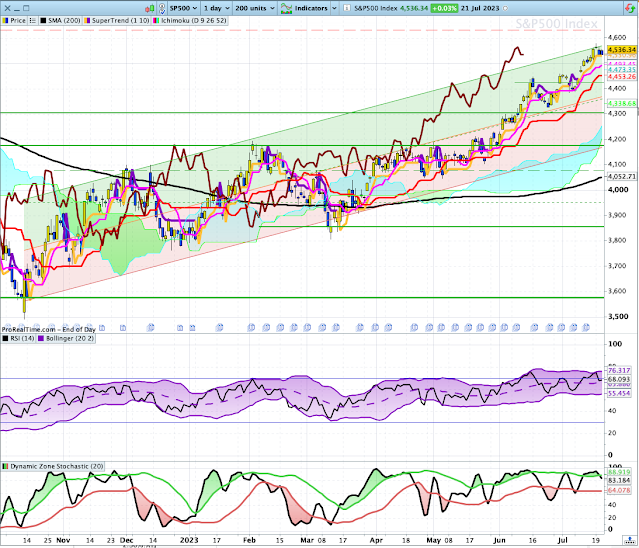
SPX has been finding resistance at the Median Line of the Andrews' Pitchfork. The possibilities lie to the downside.Dynamic Zone Stochastic is showing a negative divergence and has fallen below its upper-band which reinforces the view that SPX will probably break to the downside.The chart shows the 40-Week Moving Average which is equivalent to the 200-Day Moving Average referenced in the Introduction above. That gives us a long-term bullish picture.Below is a Daily Chart for SPX with a Standard Error Channel overlay. The Channel starts at the major low of October, 2022.
The daily chart of SPX is now at the top of the Standard Error Channel. Expect a pullback.
The narrow range Doji Candlestick on Wednesday, coming at the top of a rally, probably indicated the end of the rally, at least in the short-term.
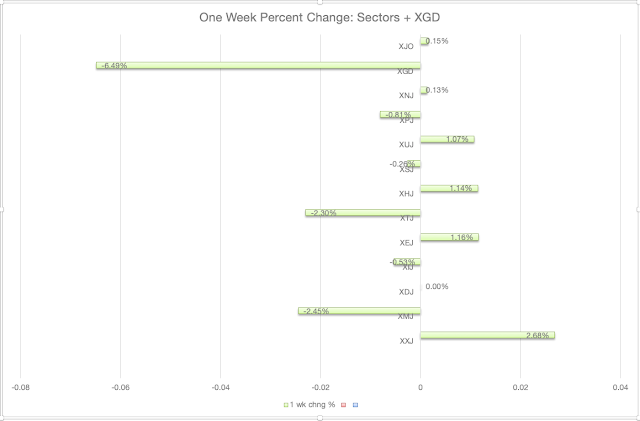
Sector Performance this past week.
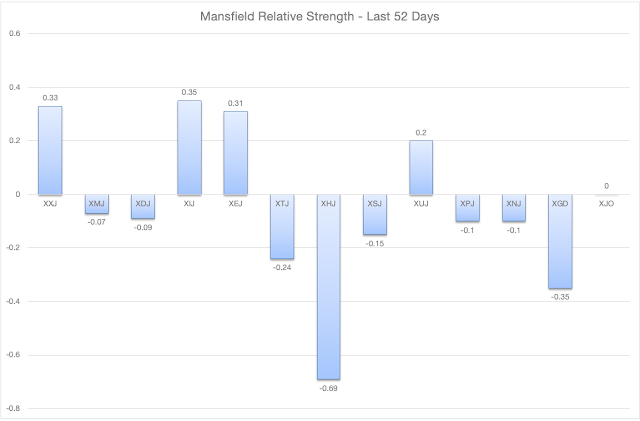
XXJ (Financials) was the best performing sector, up +2.68% followed by XEJ(Energy) +1.16% and XHJ (Health) +1.14%.XGD (Gold Miners) which is an industry group within XMJ fell heavily -6.49% after rising the previous week a massive +9.84%. Savvy traders using Technical Analysis can make good money in the Gold Miners, but it is not for the faint hearted.The same can be said for XIJ (Inormation Technology) which was the worst performing Sector, down -2.45%. XIJ fell heavily on Friday, down -2.73%, wiping out all of the previous four days' gains. The quality of the fall in XIJ on Friday suggests that its up-trend has finished for the time being.From its low in June 2022, XIJ has been up 55%. So it's had a great run for over a year.52-Day Mansfield Relative Strength.
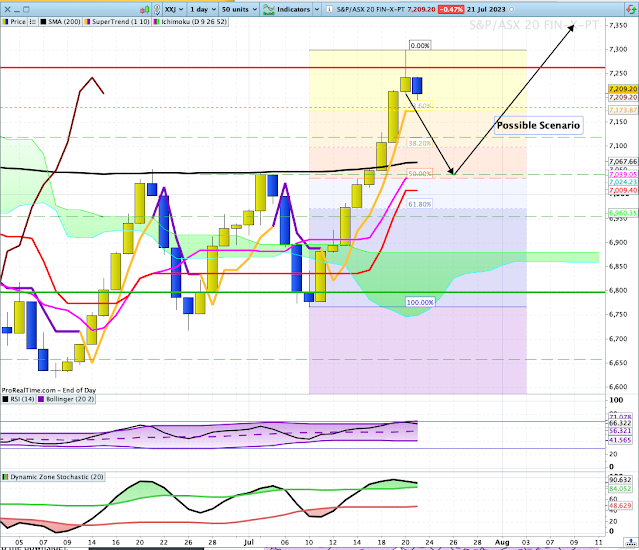
The best performing Sector over the past 52 Days have been XIJ (Information Technology), but, as I mentioned above, its run may have ended. Look to XXJ (Financials) to take over market leadership.Here's the daily chart for XXJ with a possible scenario:
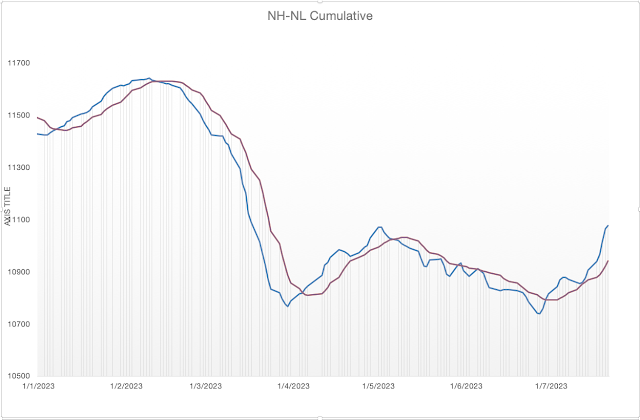
NewHighs-NewLows Cumulative.
NH-NL Cum bottomed at the beginning of July and is now in an ABCD bullish rally. Longer term investors should remain invested while the chart is above its 10-Day MA.%100 Leader Stocks above 200/50/10 Day Moving Averages.% of Stocks above the 200-Day MA: Last week 461%, this week 62%.% of Stocks above the 50-Day MA: Last week 67%, this week 60%.% of Stocks above the 10-Day MA: Last week 81%, this week 60%.% of Stocks positive on the Hull MA13: Last week 67%, this week 45%.
Internals have weakened this week while the XJO made a small advance.
Conclusion.XJO is at a major inflection point with a bearish tomb-stone doji candlestick appearing on Thursday right at a major horizontal resistance zone. This may provide a buy-the-dip opportunity.
SP500 may also be at an inflection point with the Index sitting at the median line of its Andrews' Pitchfork.
I am confident of a pull-back here which will likely be bought leading to another strong up-leg.
Remember that September is historically a weak month.
17/07 Indices, page-151


Add XJO (ASX) to my watchlist
 (20min delay) (20min delay)
|
|||||
|
Last
7,848.1 |
Change
-3.600(0.05%) |
Mkt cap ! n/a | |||
| Open | High | Low |
| 7,851.7 | 7,879.6 | 7,848.1 |
| XJO (ASX) Chart |