23/10/22. Weekly Wrap - Week ended 21/10/22.
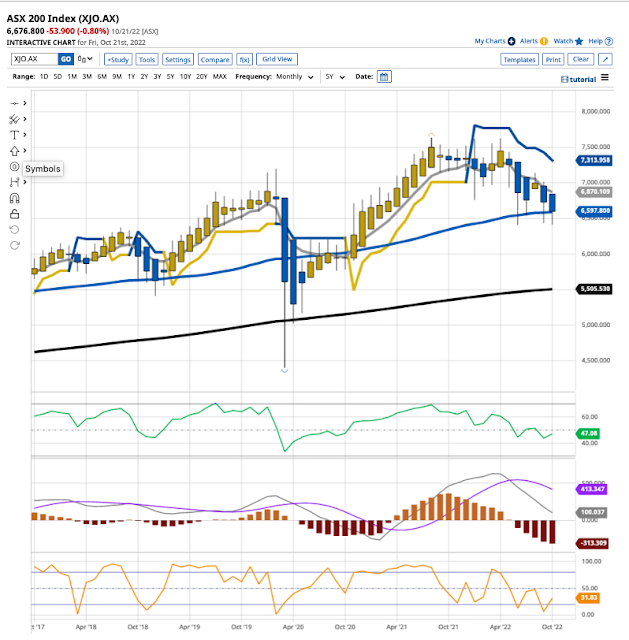
XJO Monthly Chart.
XJO continues to hold at support of the 50-Month Moving Average.
It remains in a down-trend, below the 8-Month Exponential Moving Average and below the Supertrend Line (7.1.5). This down-trend started a year ago.
The average bear market is 289 days - or about nine months. We're beyond that now - so we could see a rebound soon. But - you know what they say about averages?
Plans based on the assumption that average conditions will occur are wrong on average. A humorous example involves the statistician who drowned while fording a river that was, on average, only three feet deep.
Only take action on this chart at the end of the month - one week to go.
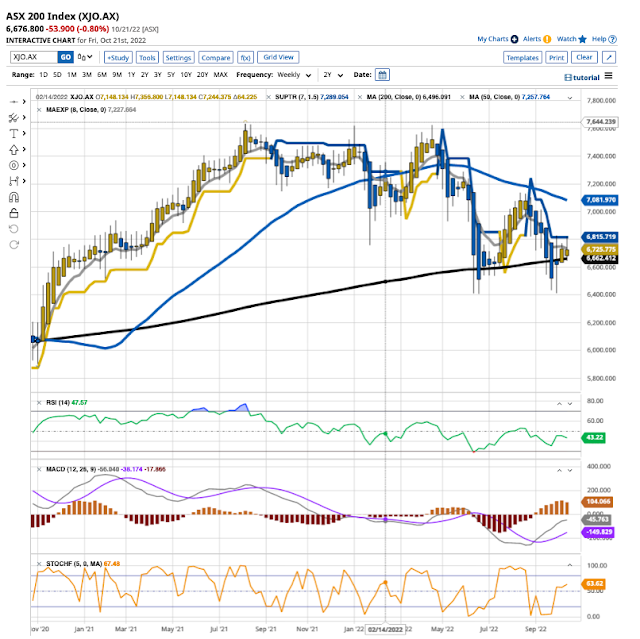
XJO Weekly Chart.
In this chart we can see the importance of the 200-Week Moving Average. It's been support since mid-June this year. There's been a nice tradable rally since then, but XJO has been revisiting that level for the past 5 weeks without breaking decisively below.
Resistance is being provided by the weekly Supertrend Line (7,1.5). A break above that would be bullish.
XJO Daily Chart.
XJO in the short-term remains in a sideways consolidation pattern.
It remains in a down-trend (lower highs and lower lows).
If it can get above the 50-Day MA (likely next week) we could see a test of the 200-Day MA.
For now, monthly, weekly, and daily charts are in sync - bearish.
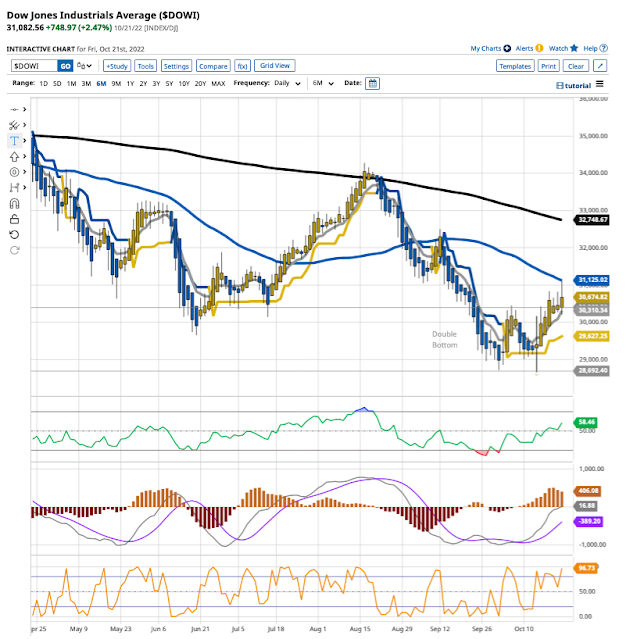
Dow Jones Industrial Average Daily.
Dow Jones has formed a double bottom - usually a reliable precursor to a sustainable rally.
The chart is now finding resistance at the 50-Day MA. A break above that would be bullish and should see a test of the 200-Day MA.
On Friday night, Dow Jones was up +2.47% - and the ASX should follow suit - but not of the same magnitude.
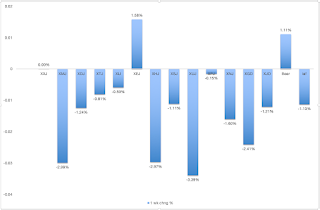
ASX Sector Results for this week.
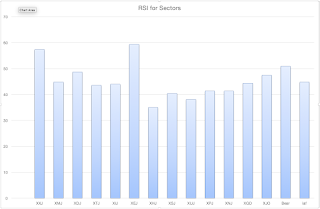
It was a poor week for the XJO which was down -1.21%. Only one sector was up - Energy +1.58%. Worst were Utilities -3.39%, Materials -2.99% and Health -2.97%. Financials was flat 0.00%.Relative Strength of Sectors.
RSI (Relative Strength Index) is calculated using the default setting of 14 days - almost three weeks of trading. It provides a more reliable guide to changes in sectors than the one-week results which can jerk around quite a lot and, thus, RSI is probably a more reliable guide to recent strength in the sectors. (Click here for a description of RSI.)
Two sectors out of eleven are above 50. The previous week we saw four sectors above 50 - so breadth is wearing. Leadership is shared by Energy and Financials - the only two sectors above 50.NewHighs-NewLows Cumulative.
This is a metric for the long-term investor. While NH-NL Cumulative remains below its 10-Day Moving Average, it is best for long term investors to remain cautious and defensive regarding the market.
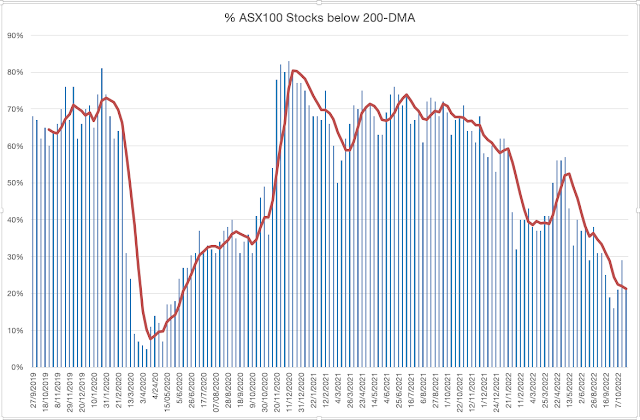
% of Stocks above key moving averages.1. % of stocks above 10-Day Moving Average: Last Week 54%, This Week 35%.2. % of stocks above 50-Day Moving Average, Last Week 27%, This Week 22%.3. % of stocks above 200-Day Moving Average, Last Week 29%, This Week 21%.Those three metrics remain bearish.The long term metric (% Stocks below 200-Day MA) remains bearish. It is sitting at its 5-Week MA which it was above last week. The chart remains above the low of three weeks ago. That's promising. I'd like to see this above at least 40% before feeling comfortable.Conclusion.Overall, our market remains bearish, but we may be seeing a nascent counter-trend rally.Bear markets can often end very quickly. Don't be a victim of recency bias. Bear markets can end very quickly. The market tends to be forward looking and may be ready to discount the higher for longer mantra of the Federal Reserve.
I'll repeat the quote I left you with last week.Interestingly, the stock market in 2022 has generally followed the downward path typical for a midterm election year since 1962, according to Dan Clifton at Strategas. The S&P 500 is down slightly more than the typical 19% intra-year decline, but the news improves if stocks stick to the script. Stocks have historically bottomed in October and rallied by an average of almost 32% in the next twelve months. Clifton notes that stocks have been positive in the year after every midterm election since 1942!Stay Safe.
- Forums
- ASX - By Stock
- 17/10 Indices
23/10/22. Weekly Wrap - Week ended 21/10/22.XJO Monthly...
- There are more pages in this discussion • 1 more message in this thread...
You’re viewing a single post only. To view the entire thread just sign in or Join Now (FREE)
Featured News
Add XJO (ASX) to my watchlist
 (20min delay) (20min delay)
|
|||||
|
Last
7,749.0 |
Change
27.400(0.35%) |
Mkt cap ! n/a | |||
| Open | High | Low |
| 7,721.6 | 7,768.5 | 7,721.6 |
Featured News
| XJO (ASX) Chart |

