
ASX continued to surge higher today. XJO +0.84%. It is now above the previous year high set in late July, 2023.
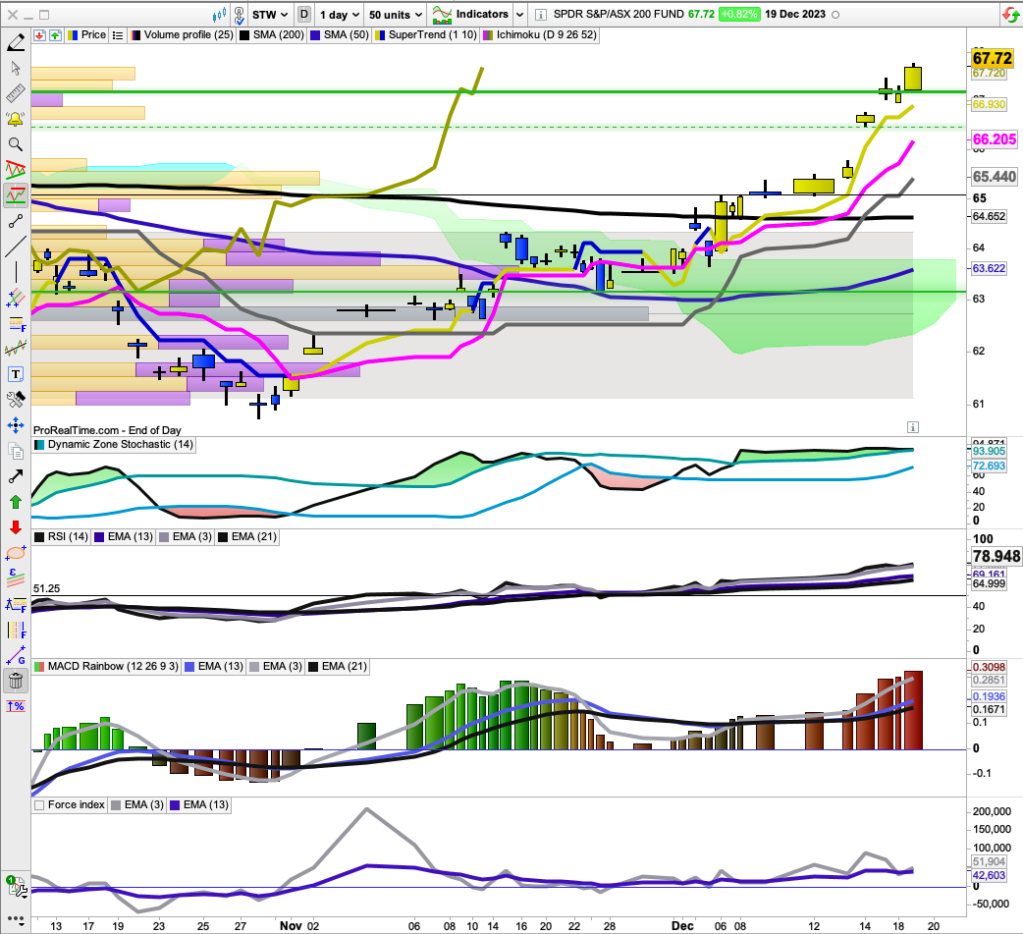
Chart for STW (ETF for XJO).
Volume was heavy today on STW which might indicate "strong hands" selling to exuberant "weak hands".
RSI set another yearly high today.
DZ Stochastic has flattened out and is close to giving a short-term sell signal.
I'd like to see a confirmation on the RSI by breaking lower.
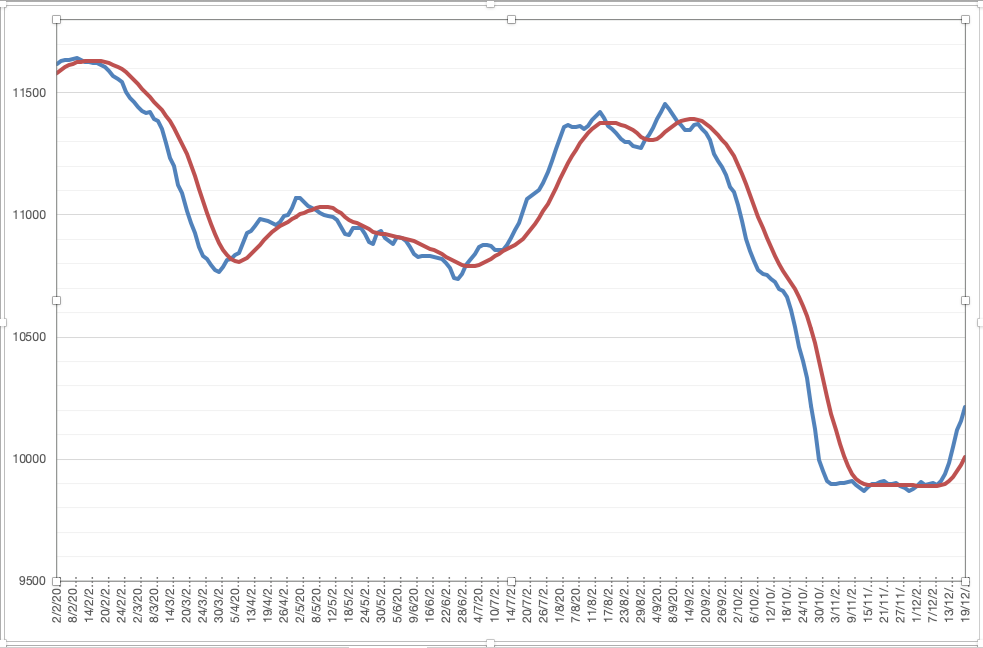
Cumulative New Highs and New Lows.NH-NL Cumulative continues its bullish upside movement.
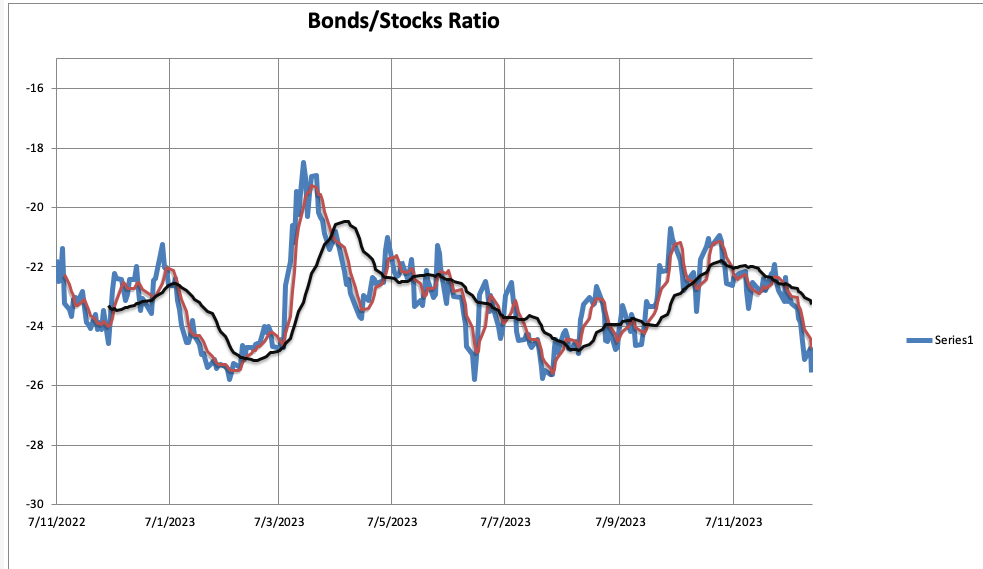
Bonds/Stocks RatioWhenever Bonds/Stocks Ratio has reached a low point around -25.8, the STW has staged a fall. Bonds/Stocks Ratio is currently at 25.55. Not quite down to 25.8 - so Stocks still have a little wriggle room to the upside. Lows occurred on 8/2/23, 20/6/23 and 27/7/23.
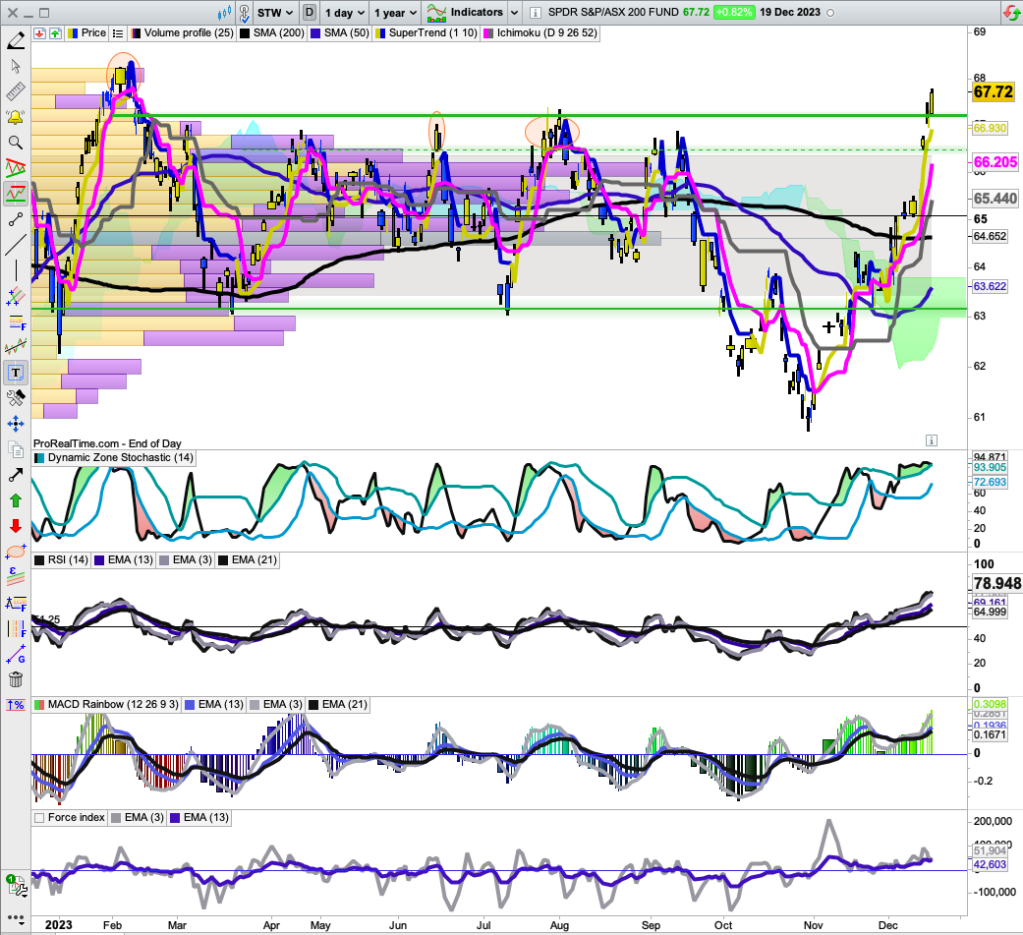
Here's the chart for STW with relevant dates of extreme lows for Bonds/Stocks ratio market with an ellipse.European markets are choppy but moving to the positive side in early trading. STOXX600 +0.13%. Dow Futures flat at +0.08%.
U.S. 10-Yr Bond Yield is down -0.05. Yield is well under 4%. In late October, it seemed likely to hit 5%. Falling Bond Yields are a positive for the Stock Market.
ASX continued to surge higher today. XJO +0.84%. It is now above...


Add XJO (ASX) to my watchlist
 (20min delay) (20min delay)
|
|||||
|
Last
7,627.6 |
Change
51.700(0.68%) |
Mkt cap ! n/a | |||
| Open | High | Low |
| 7,575.9 | 7,638.7 | 7,575.9 |
| XJO (ASX) Chart |