Just though I'd do a Goldie Locks and jump in before the Bears woke up...lol
All 3 charts are looking Bullish Imo.
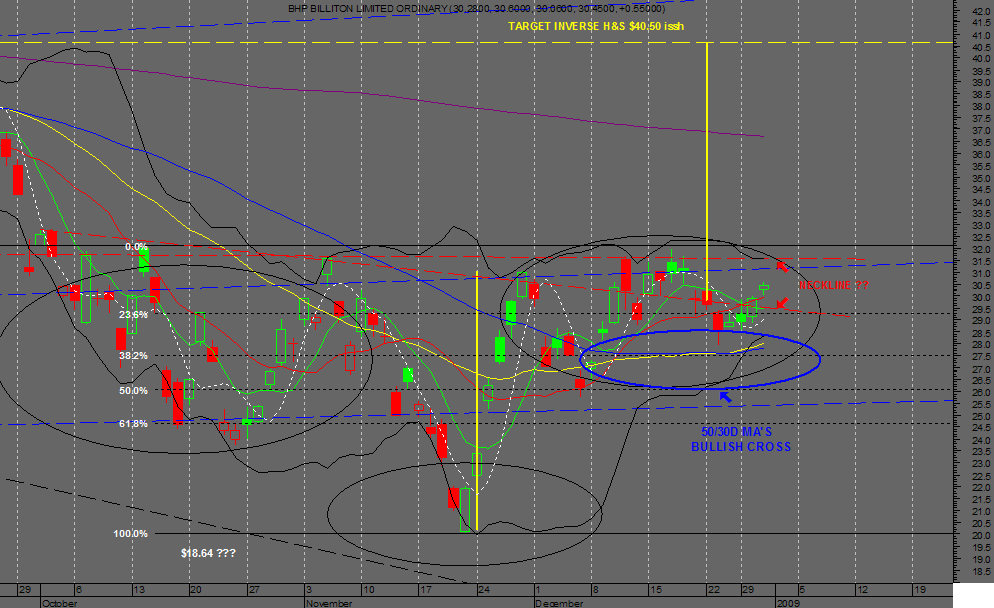
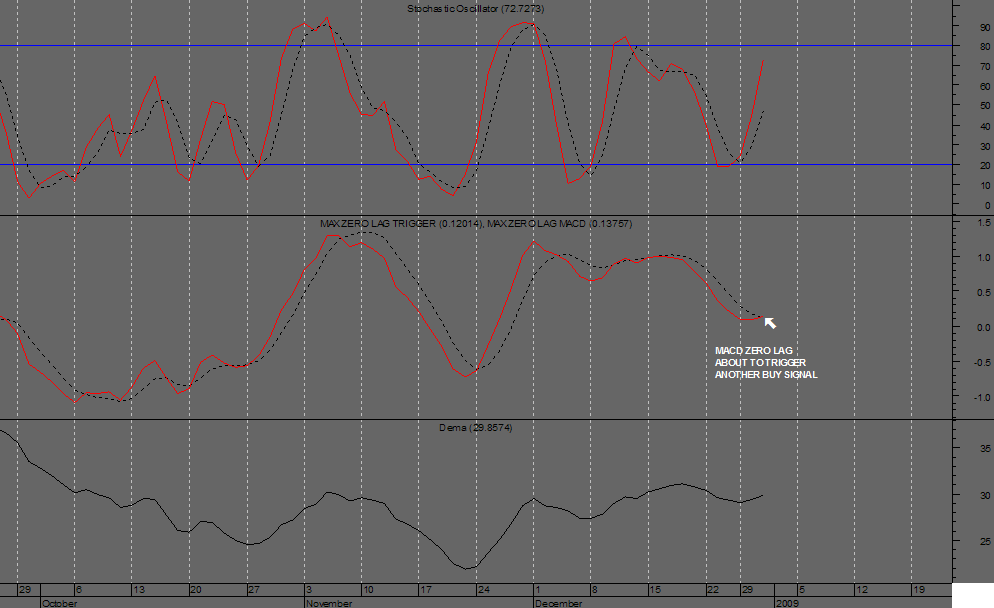
The Daily has a Inverse H&S forming the right shoulder ATM with a target of $40.50 issh depending on which neckline you use? I'm favoring the top one,50D/30D MA's have just crossed and the Zero Lag Macd is about to throw another Buy Signal and the other Inds have further to go.
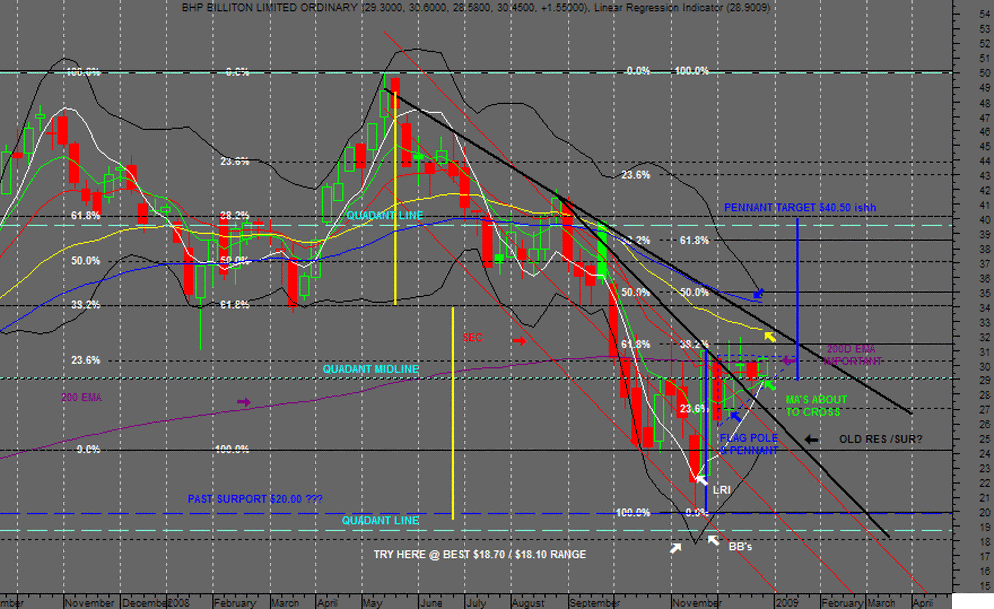
On the Weekly there is a Pennant with a similaur target so they tend to back each other up..imo
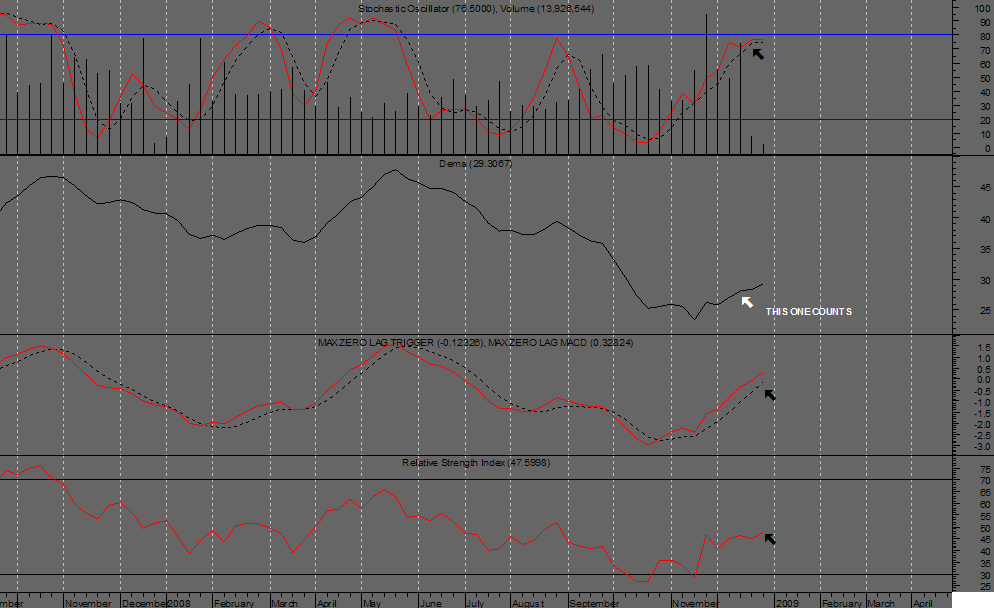
Weekly 7D/14D MA's are also about to cross,apart from the Stochastic's all other Inds have further to go as well so a break above the 200D EMA is important wich it just did but only by a Bee's you know..imo.
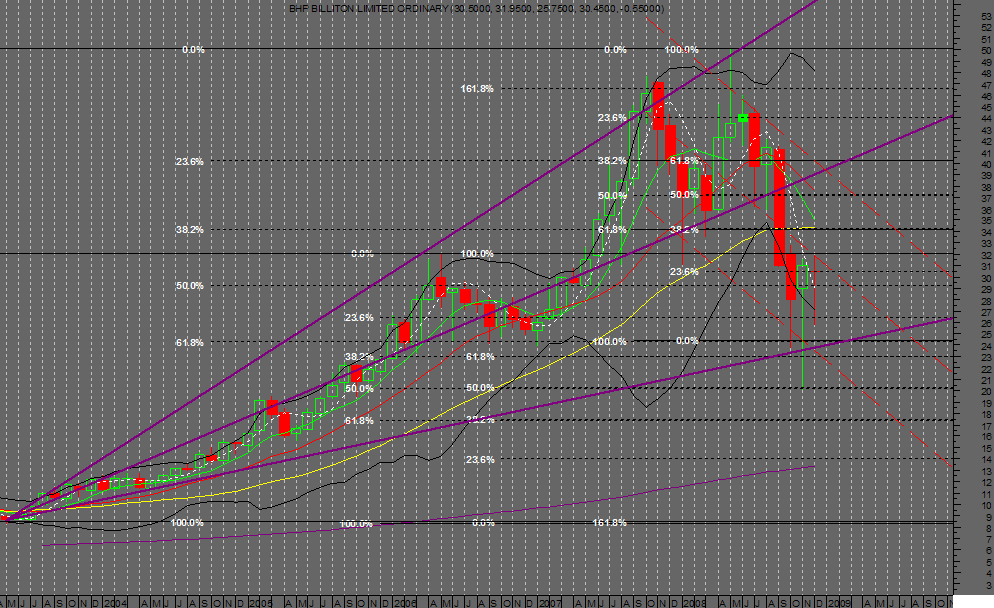
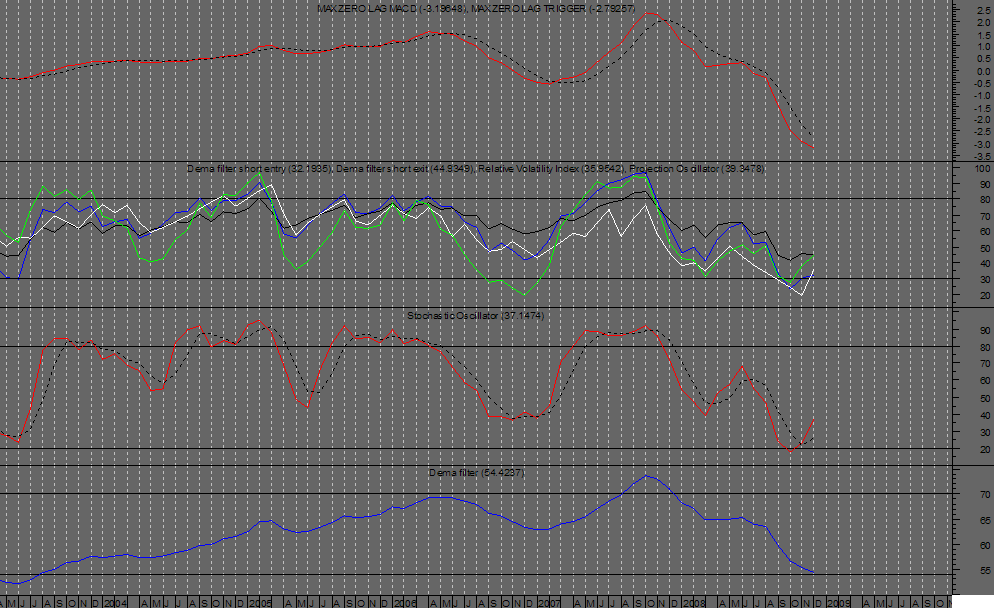
Monthly charts show a Candle Bottom check last 2 candles with most Inds showing oversold and about to turn..imo
So it could be a good start to the year fingers crossed the SP500 & DOW are also looking Bullish Imo..
I hope you all had a happy and safe break.
Cheers Pete
Daily
Weekly
Monthly
- Forums
- ASX - By Stock
- BHP
- 1st chart of the year
1st chart of the year
-
- There are more pages in this discussion • 21 more messages in this thread...
You’re viewing a single post only. To view the entire thread just sign in or Join Now (FREE)
Featured News
Add BHP (ASX) to my watchlist
 (20min delay) (20min delay)
|
|||||
|
Last
$43.56 |
Change
0.390(0.90%) |
Mkt cap ! $221.5B | |||
| Open | High | Low | Value | Volume |
| $43.64 | $43.73 | $43.26 | $211.2M | 4.849M |
Buyers (Bids)
| No. | Vol. | Price($) |
|---|---|---|
| 2 | 11133 | $43.55 |
Sellers (Offers)
| Price($) | Vol. | No. |
|---|---|---|
| $43.57 | 5435 | 3 |
View Market Depth
| No. | Vol. | Price($) |
|---|---|---|
| 2 | 51599 | 47.910 |
| 1 | 2797 | 47.850 |
| 1 | 7468 | 47.400 |
| 2 | 439 | 47.040 |
| 2 | 9285 | 46.820 |
| Price($) | Vol. | No. |
|---|---|---|
| 40.500 | 1600 | 1 |
| 40.520 | 3811 | 2 |
| 41.040 | 5718 | 1 |
| 41.380 | 13461 | 11 |
| 41.390 | 323607 | 26 |
| Last trade - 16.10pm 11/07/2024 (20 minute delay) ? |
Featured News
| BHP (ASX) Chart |
