
Yep, it's that time of the month again. Punters sit glued to the screen waiting for the monthly Interest Rate Decision from the RBA. Then the pundits will parse every word coming from the mouth of the Big Boss of the RBA - Phil Lowe. Good luck to mortgage holders.
XJO Daily Chart.
XJO up this week, +1.47%. But technicals are indecisive.The chart sits in the Kumo Cloud - the non-trade zone.Conversion Line and Base Line are sitting together - If the chart goes up - Conversion Line rises above the Base Line - a probable buy signal.If Chart goes down - Conversion Line falls below the Base Line - a probable sell signal.Looks like the RBA is holding the stock market in its hands. Amazing how this happens ahead of critical announcements.American SP500.
The American chart looks nothing like the Australian chart. They've decoupled.SP500 is in a strong up-trend.SP500 tells us little about the prospects for the Ozzie market.Sector Performance this past week.
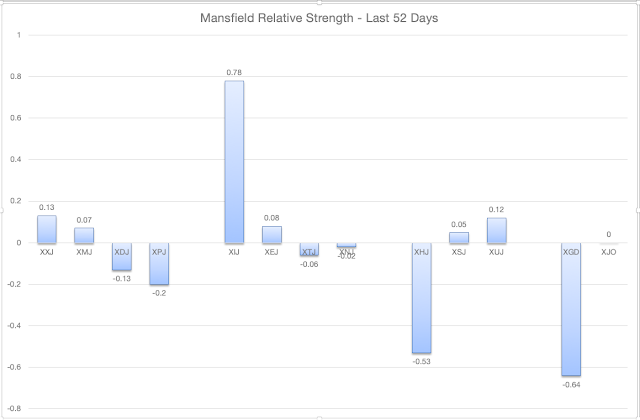
This Week's Sector Performance Chart tells a story.On the right-hand side of the chart I've grouped the Defensives. XHJ (Health), XSJ (Staples) and XUJ (Utilities) - all are negative.The stand-out is XIJ (Info.Tech) up 4.52%.On the left-hand side are the cyclicals. XXJ (Financials), XMJ (Materials), XDJ (Discretionary) and XPJ (Property)Although XIJ is the stand-out, on balance, there's been a shift out of Defensives into Cyclicals. That's bullish for the stock market.Of course, that's only a short-term snap-shot. That can quickly change.Change over the Medium Term and Long Term.For longer term views I turn to the 52-Day and 52-Week Mansfield Relative Strength Indices.52-Day Mansfield.52-Week MansfieldNo matter how you cut and dice it, XIJ in the short, medium and long-term has been the place to be. And the place to avoid - XHJ.NewHighs-NewLows Cumulative.This chart trends fairly strongly. Since the beginning of the year it has had four clear moves, up, down, up, down. The down moves have been longer lasting than the up moves.NH-NL CUM has kicked up above its 10-week MA. That might suggest a start to a new up move.That might depend on reaction to the RBA's Interest Rate Decision.Next week should be interesting.July tends to be a positive month.I'm tending to the bullish side at this stage but - like the RBA - I'll be driven by the data.
26/06 Indices, page-126


Add XJO (ASX) to my watchlist
 (20min delay) (20min delay)
|
|||||
|
Last
7,971.1 |
Change
105.600(1.34%) |
Mkt cap ! n/a | |||
| Open | High | Low |
| 7,865.5 | 7,976.9 | 7,865.5 |
| XJO (ASX) Chart |