
6/11/22. Weekly Wrap - Week ended 4/11/22.
XJO Monthly Chart.
XJO continues to hold at support of the 50-Month Moving Average.
It remains in a down-trend, below the 8-Month Exponential Moving Average and below both Supertrend Lines. This down-trend started over a year ago.
The average bear market is 289 days - or about nine months. We may be seeing a sustainable rebound - but after only one week in November, it is too early to say.
XJO Weekly Chart.
XJO had a good week this week with the index up +1.57% after being up +1.63% the previous week. The two Supertrend Lines on this chart are yellow, i.e., up-trending.Hull MA13 is also indicating an up-trend.These are medium term signals.A move back above the 50-Week MA would be a bullish signal.XJO Daily Chart.
XJO is locked between resistance of the 200-Day MA and horizontal support at about 6800 (round figures).The 200-DMA has acted as support or resistance multiple times in the past year. (The above chart only shows three months).A decisive break above 200-DMA would be bullish. That is often seen as the demarcation line between bull and bear.Action in the U.S. may prove to be decisive on Monday. Stock indices were up strongly, but Commodities went berserk. Below is the Commodities Index chart showing the action.Commodities Index Daily Chart
DBC was up +3.38% on Friday. Friday's candle looks like a rocket launch into outer space. In the previous three months, the best DBC could do was about +2.75% (three times).
That should also launch our energy and mining stocks up higher.
BHP was up +9.75% higher in the U.S. on Friday night. Don't expect the same result in Australia on Monday - but it will be a lot higher than it closed on Friday.
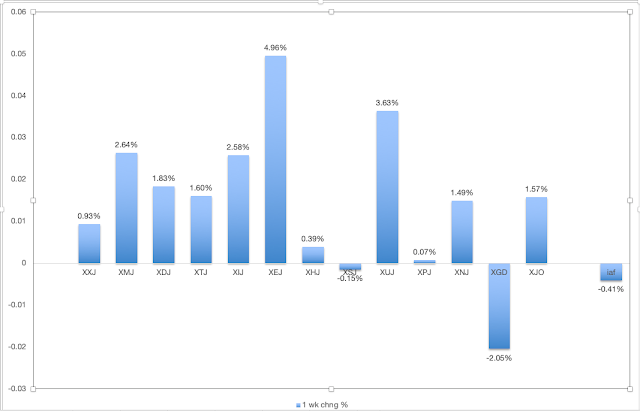
ASX Sector Results for this week.
It was a good week for the XJO with ten out of eleven sectors up. The two resource sectors did well this week, Materials +2.64% and Energy +4.96%. The only negative sector was Consumer Staples, down marginally -0.15%. Property was up marginally +0.07%Relative Strength of Sectors.
RSI (Relative Strength Index) is calculated using the default setting of 14 days - almost three weeks of trading. It provides a more reliable guide to changes in sectors than the one-week results which can jerk around quite a lot and, thus, RSI is probably a better guide to recent strength in the sectors. (Click here for a description of RSI.)
Nine sectors out of eleven are above the 50 level - that represents a bullish result. That's a dramatic improvement from tow weeks ago when only two sectors out of eleven were above 50. Leadership is held by Energy (XEJ) Financials (XXJ). Look to buy pull-backs in strong stocks in those two sectors.NewHighs-NewLows Cumulative.
This is a lagging indicator but bullish signals are usually highly reliable.
This is a metric for the long-term investor. While NH-NL Cumulative remains below its 10-Day Moving Average, it is best for long term investors to remain cautious and defensive regarding the market.
% of Stocks above key moving averages.1. % of stocks above 10-Day Moving Average: Last Week 64%, This Week 59%.2. % of stocks above 50-Day Moving Average, Last Week 43%, This Week 58%.3. % of stocks above 200-Day Moving Average, Last Week 33%, This Week 35%.The two longer term measures (Nos. 2 & 3) both improved this week. The slight weakness in No. 1 is due to the big sell-down on Thursday, but the overall picture is of an improving stock market breadth.% of stocks above the 200-Day MA rose again this week. Steady improvement can be seen in the bar chart and the 5-Week MA is rising.Conclusion.Given the favourable stock and commodity rises in the U.S. on Friday night we should see a very strong day on the ASX on Monday. Another test of the 200-Day MA is likely and a break above the 200-Day MA seems feasible in the coming week.I'm expecting more upside in the near-term.Stay Safe
31/10 Indices, page-203


Add XJO (ASX) to my watchlist
 (20min delay) (20min delay)
|
|||||
|
Last
7,959.3 |
Change
69.700(0.88%) |
Mkt cap ! n/a | |||
| Open | High | Low |
| 7,889.6 | 7,969.1 | 7,889.0 |
| XJO (ASX) Chart |