Hey guys,
I initally bought a small position today for a scalp which never really came about so decided i would hold it over night after i looked at a few charts.
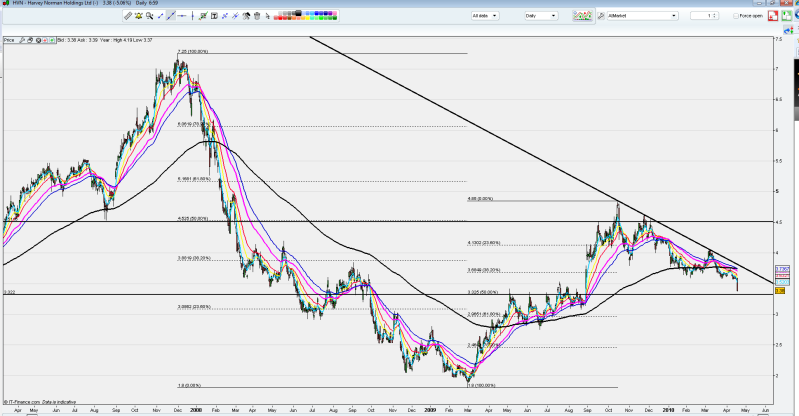
Basically this is the daily chart i have provided but on the weekly price could never close above the 50% of the major move.
I have calculated the 50% move of this last which comes around to the 3.32 level, this is a previous resistance level as we can see back from may til september of 2009 price could not really pierce and hold aboce that level as indicated in the chart. It is not clear cut and it could certainly come through that level and keep going.
The EMA's certainly looks bearish with the Death Cross happening and the strong down trend line yet to be broken. I am happy taking this trade as it is only a very small position which i would be able to get out of, i do feel the move today was quite unjustified and although i think HVN is not a good stock and will continue to be beaten by their compeition JBH i dont mind taking a small trade in it (even though it is against the trend i know)
These are just my thoughts hope they are taken with a pinch of salt :)
If u want to see more its on my blog and on the twitter :)
- Forums
- ASX - By Stock
- HVN
- 50% fib charts
HVN
harvey norman holdings limited
Add to My Watchlist
3.08%
 !
$7.37
50% fib charts
Featured News
Add to My Watchlist
What is My Watchlist?
A personalised tool to help users track selected stocks. Delivering real-time notifications on price updates, announcements, and performance stats on each to help make informed investment decisions.
 (20min delay) (20min delay)
|
|||||
|
Last
$7.37 |
Change
0.220(3.08%) |
Mkt cap ! $9.183B | |||
| Open | High | Low | Value | Volume |
| $7.40 | $7.40 | $7.28 | $12.36M | 1.678M |
Buyers (Bids)
| No. | Vol. | Price($) |
|---|---|---|
| 1 | 11978 | $7.34 |
Sellers (Offers)
| Price($) | Vol. | No. |
|---|---|---|
| $7.37 | 1000 | 1 |
View Market Depth
| No. | Vol. | Price($) |
|---|---|---|
| 1 | 11978 | 7.340 |
| 3 | 8994 | 7.330 |
| 1 | 7112 | 7.320 |
| 1 | 3000 | 7.200 |
| 2 | 1409 | 7.140 |
| Price($) | Vol. | No. |
|---|---|---|
| 7.390 | 1353 | 1 |
| 7.400 | 26785 | 8 |
| 7.410 | 5894 | 1 |
| 7.420 | 6423 | 3 |
| 7.450 | 23196 | 6 |
| Last trade - 16.10pm 16/09/2025 (20 minute delay) ? |
Featured News
| HVN (ASX) Chart |


