This Chart Of The Breakdown In Precious Metals Is Absolutely Stunning!
On the heels of continued carnage in the metals markets, this chart of the breakdown in precious metals is absolutely stunning!
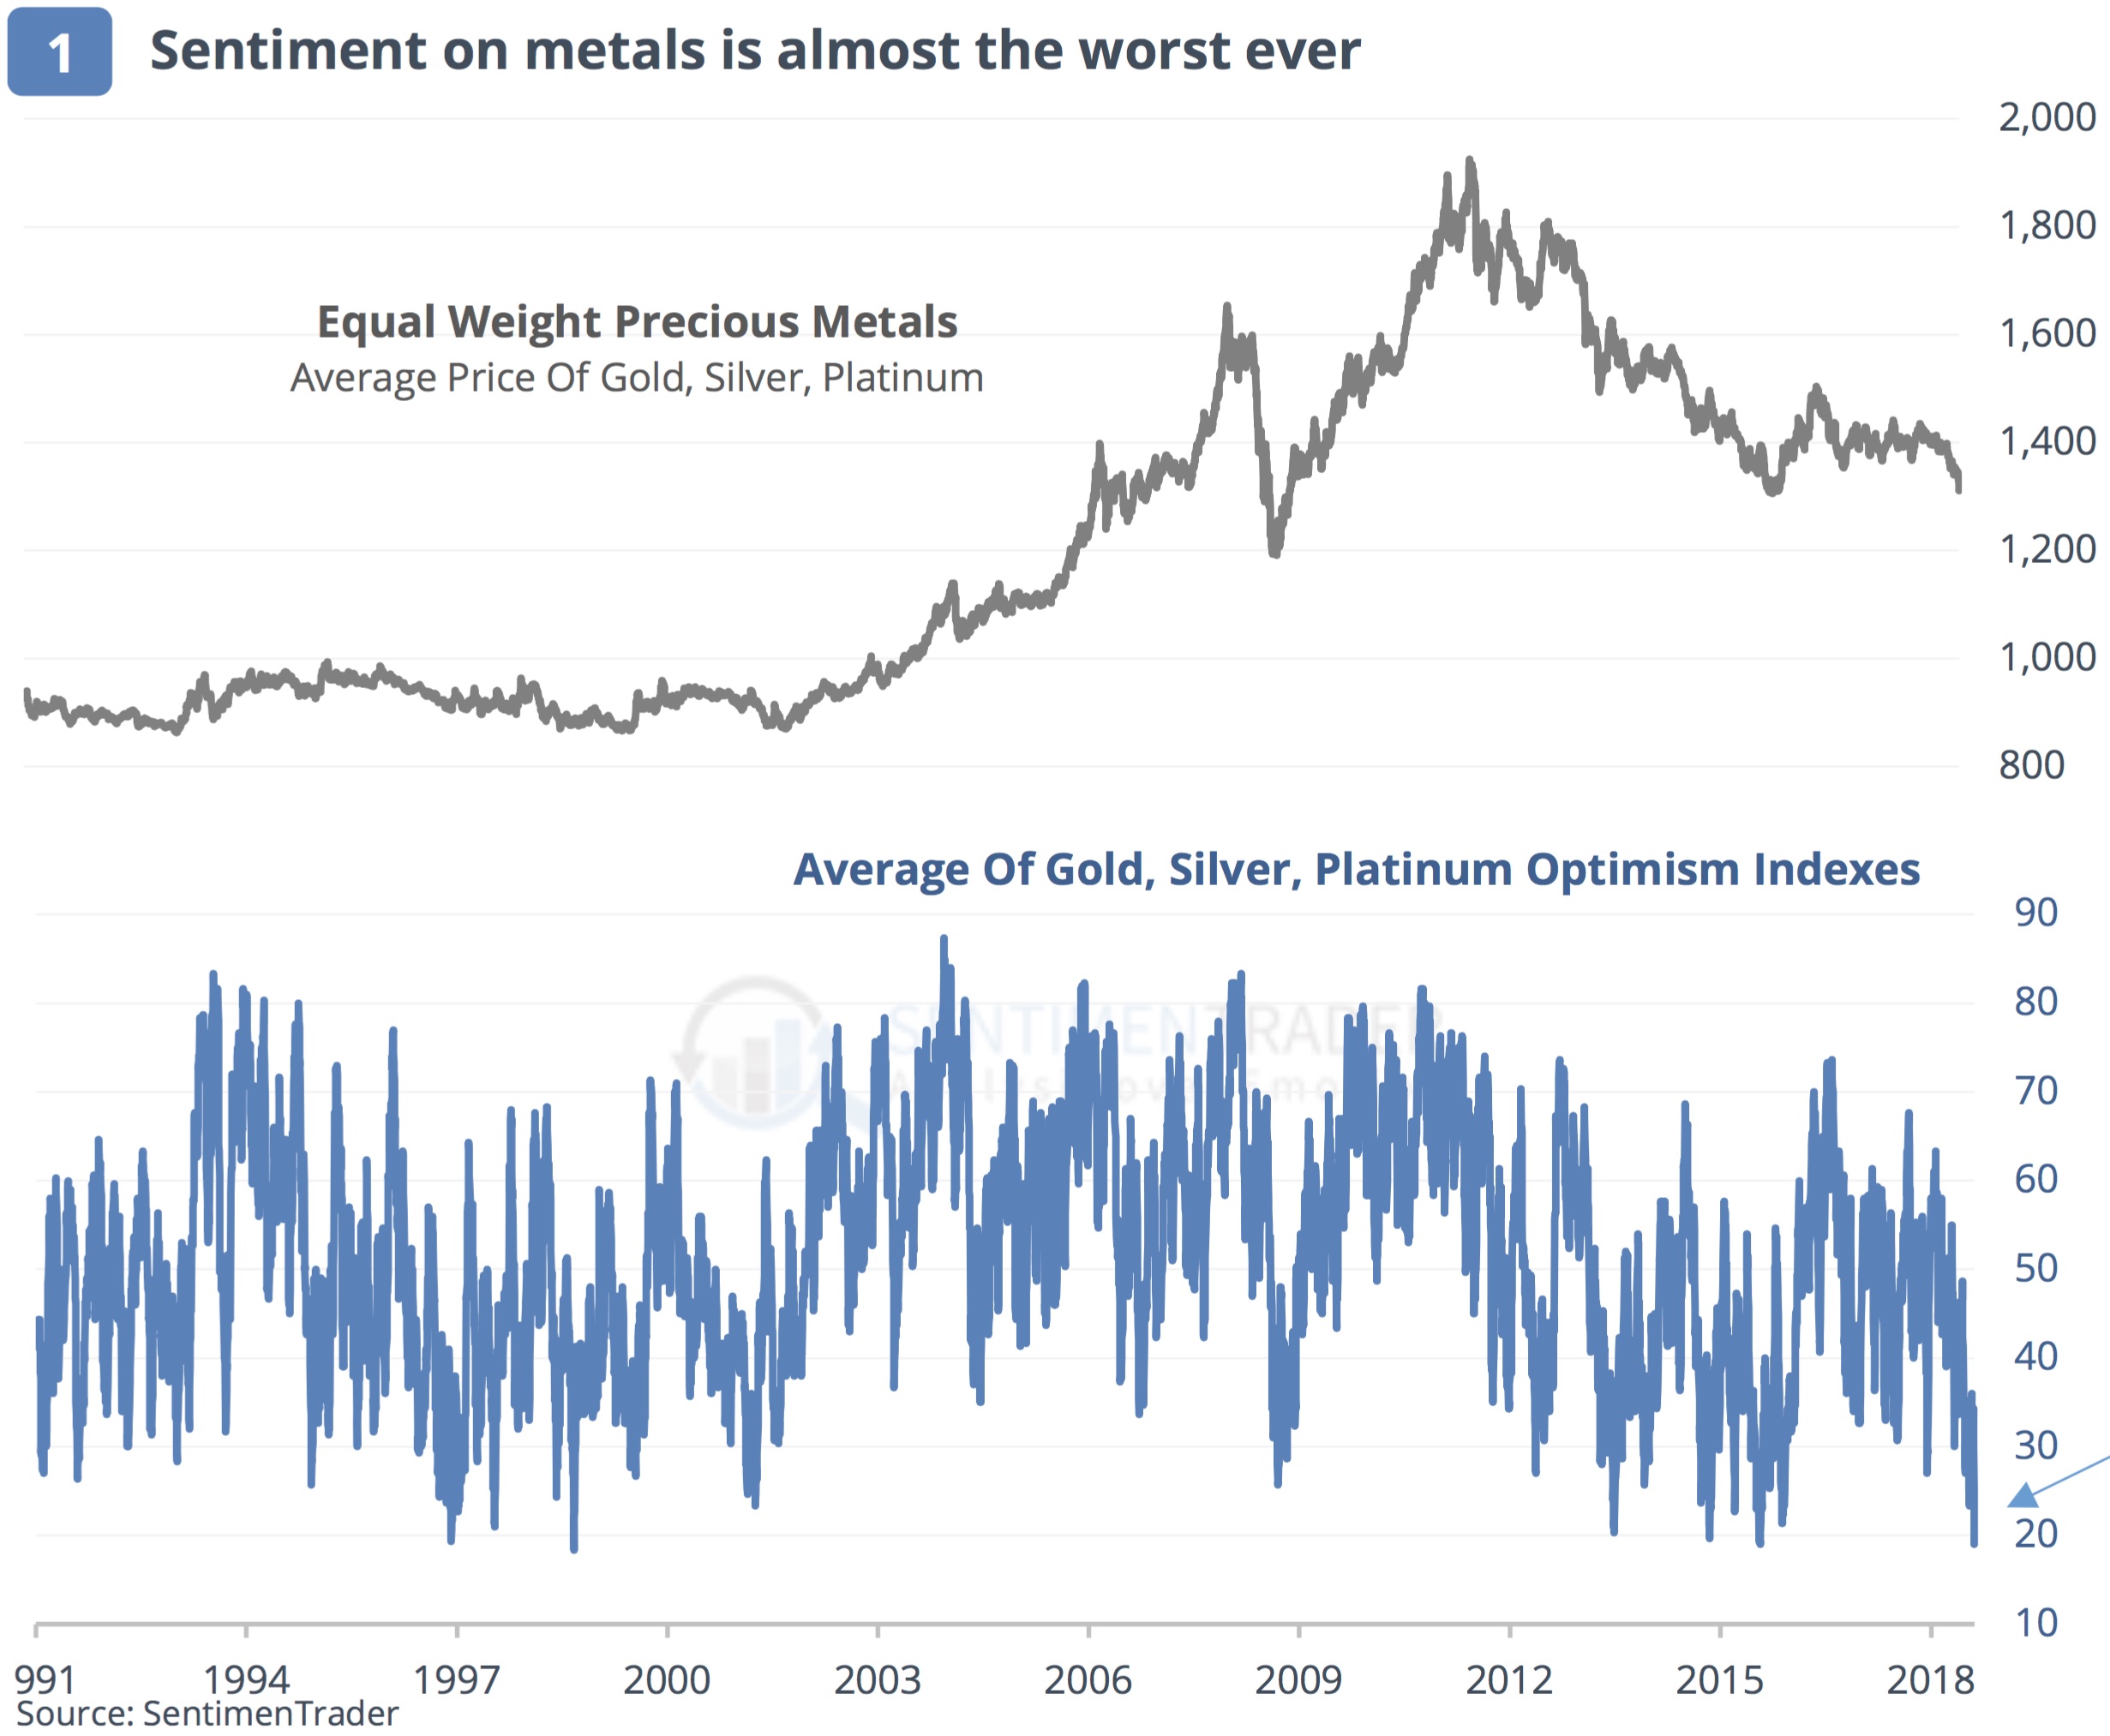
Sentiment Has Now Crashed
August 16 (King World News) – We are witnessing history. Take a look at this carnage (see chart below).
SentimenTrader: “In 27 years of history, there have been only a few days with sentiment worse than today’s in the precious metals.”
Here is a further look at collapsing sentiment in gold and silver…
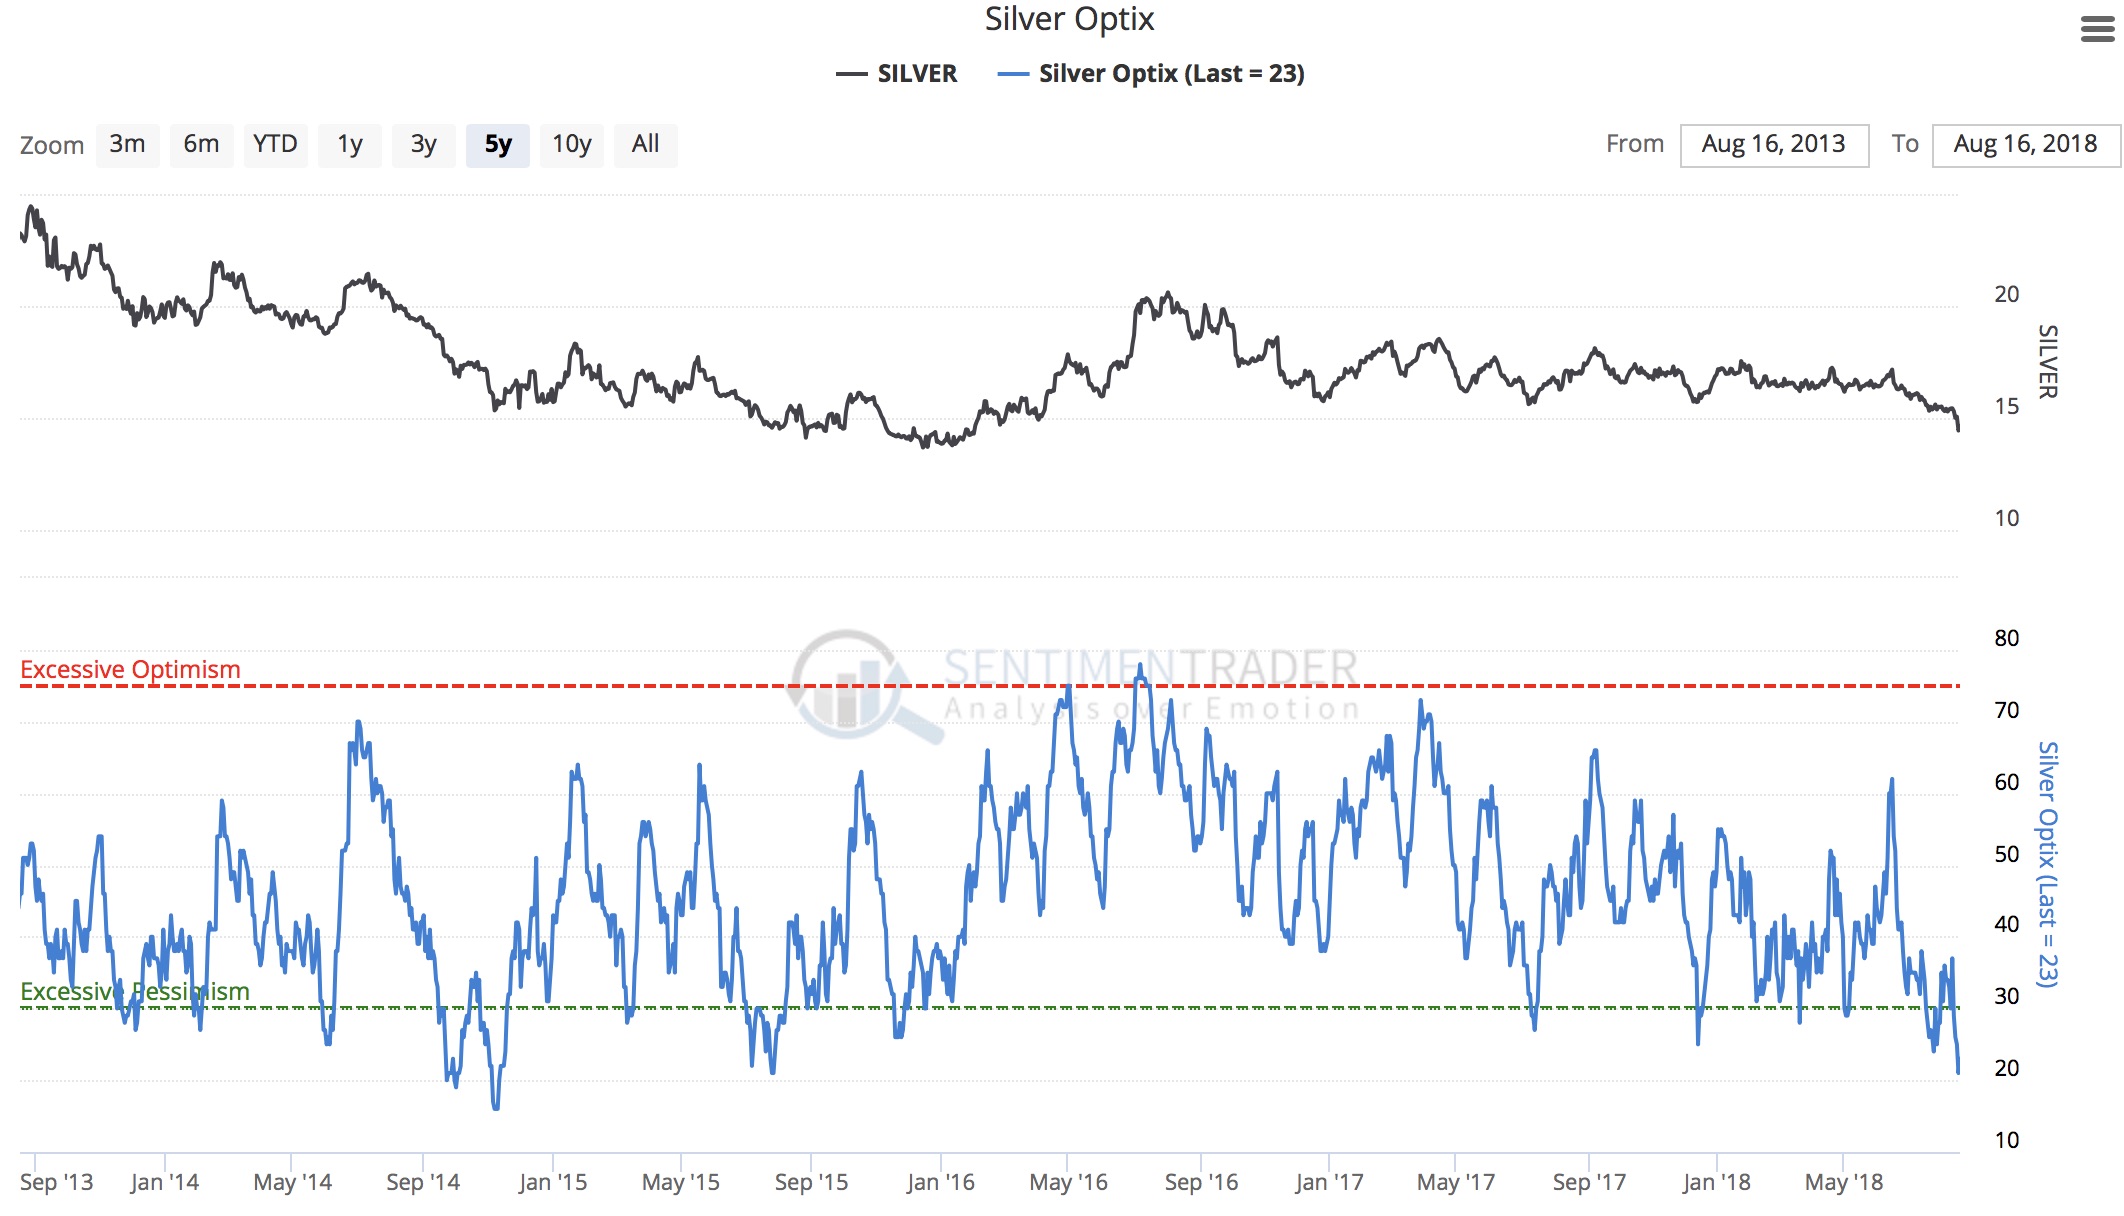
Silver Sentiment Collapses
A look at the carnage in silver (see chart below).
Sentiment In Silver Collapses!
The Same For Gold
Here is a 24-year chart of the gold market which shows the historic nature of the collapse in sentiment (see chart below).
24-YEAR CHART: Gold Sentiment Has Also Collapsed!
Stay Disciplined
The sentiment in the mining shares is extremely negative right now and that is very bullish from a contrarian perspective as we come to the end of this major panic (capitulation) bottom. If you are accumulating physical gold and silver, just continue to purchase at the normal times each month if you are dollar cost averaging. Don’t be distracted by the manias in financial markets. Instead, stay disciplined and don’t try to outsmart the market as you continue to accumulate. For those of you who are accumulating your favorite high-quality mining shares, continue to dollar cost average in the rest of August.
This Chart Of The Breakdown In Precious Metals Is Absolutely...


Add to My Watchlist
What is My Watchlist?
 (20min delay) (20min delay)
|
|||||
|
Last
2.1¢ |
Change
-0.001(4.55%) |
Mkt cap ! $30.36M | |||
| Open | High | Low | Value | Volume |
| 2.2¢ | 2.2¢ | 2.1¢ | $31.62K | 1.447M |
Buyers (Bids)
| No. | Vol. | Price($) |
|---|---|---|
| 7 | 1634358 | 2.1¢ |
Sellers (Offers)
| Price($) | Vol. | No. |
|---|---|---|
| 2.3¢ | 1946107 | 5 |
View Market Depth
| Last trade - 16.10pm 23/06/2025 (20 minute delay) ? |
| ARD (ASX) Chart |