Thought I'd throw up these charts which I will include in my pre-market post (traders thread) on Monday morning. Tough crowd here so not expecting a great deal of response but thought I'd post anyway.
DJIA daily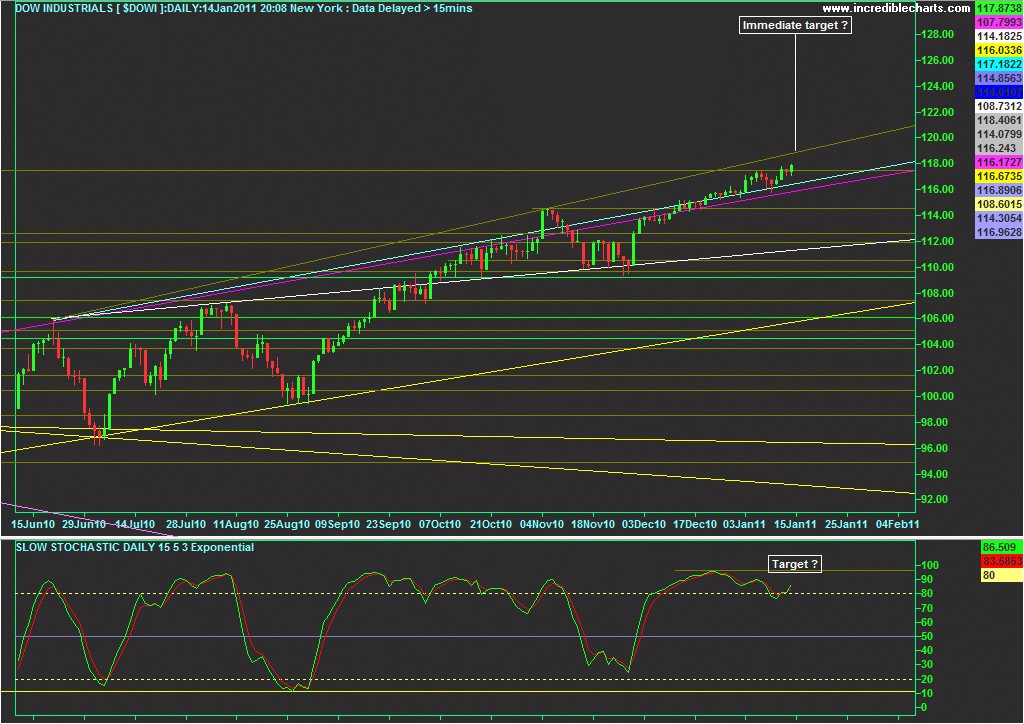
DJIA weekly (2.5 year chart)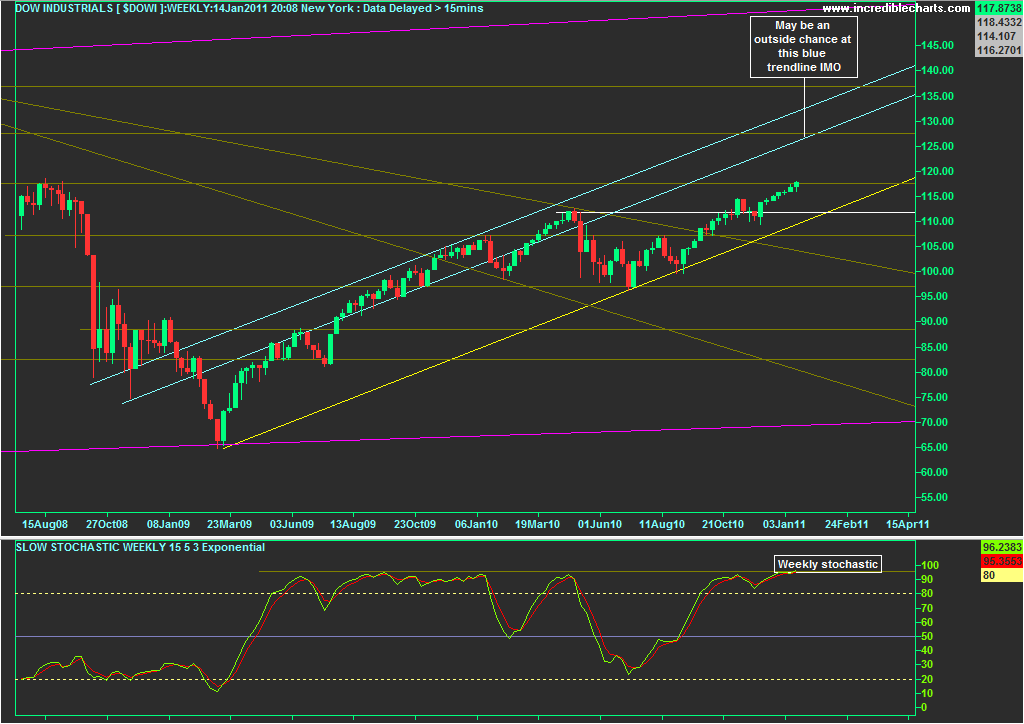
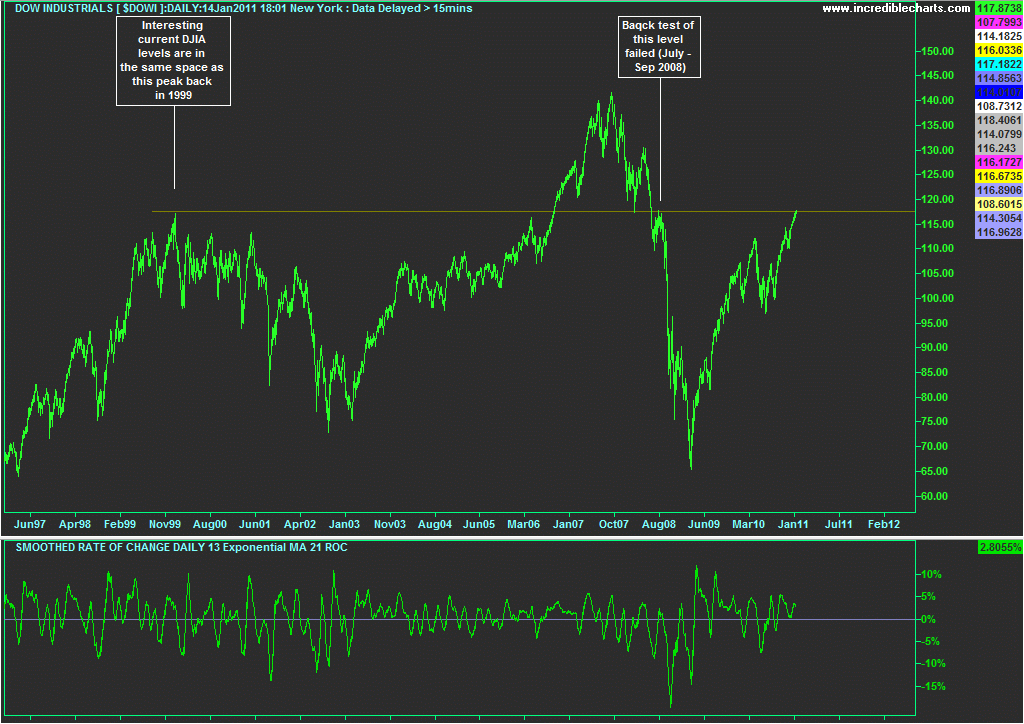
Below is a 14 year daily DJIA line chart. The index price has only managed to breakout above the current resistance level on one other occasion, from Oct 06 - June 08. The question is whether the recovery in the US presently is as strong as the bullishness in the period mentioned (well up to the end of 07 anyway)?
DJIA 14 year (daily) line chart
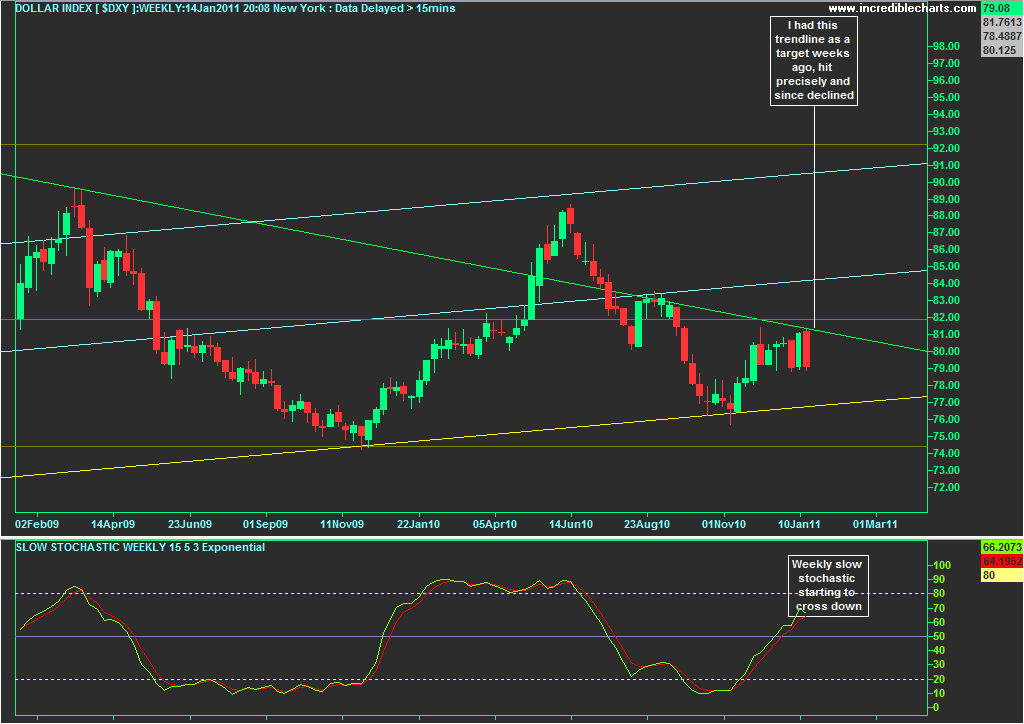
USD weekly (2 years)
USD weekly (12 years)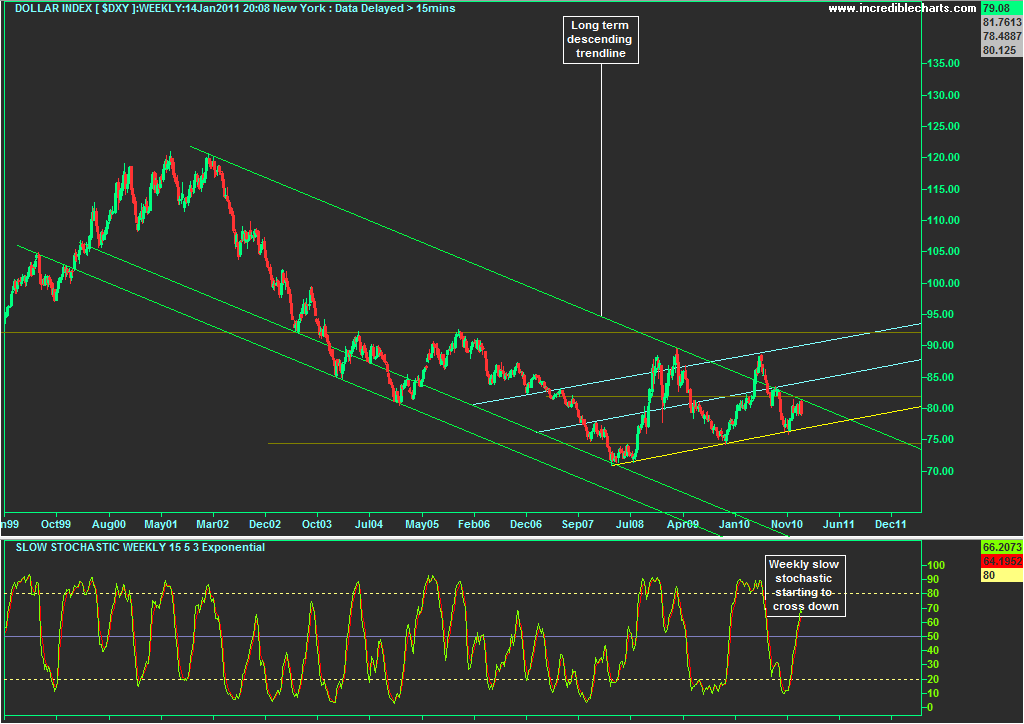
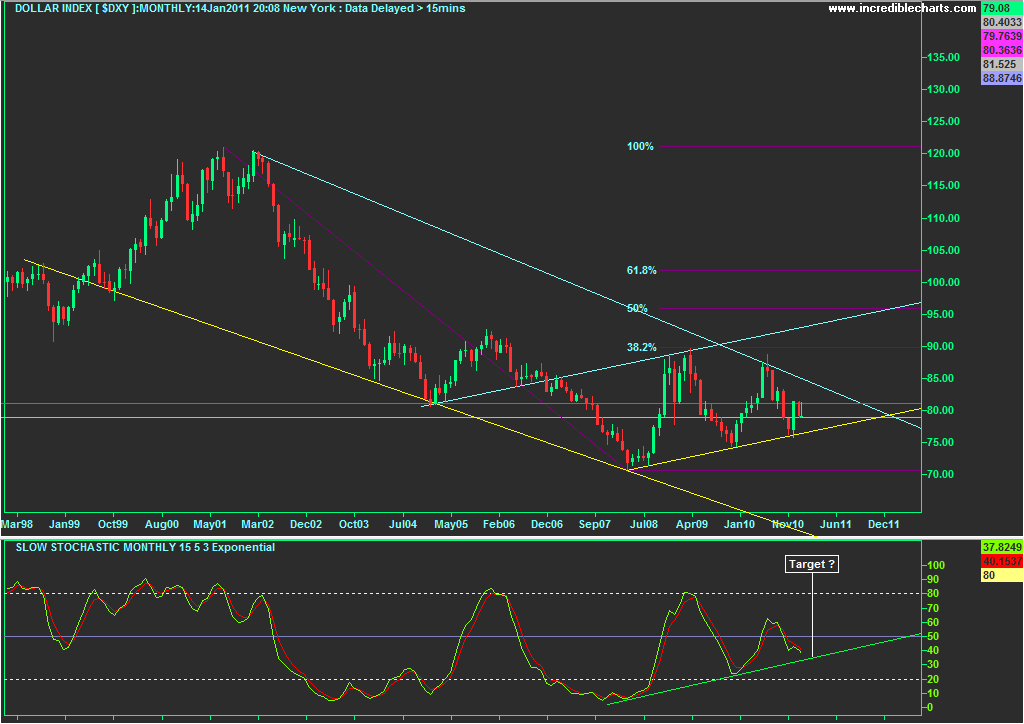
USD monthly chart (13 years) with monthly slow stochastic
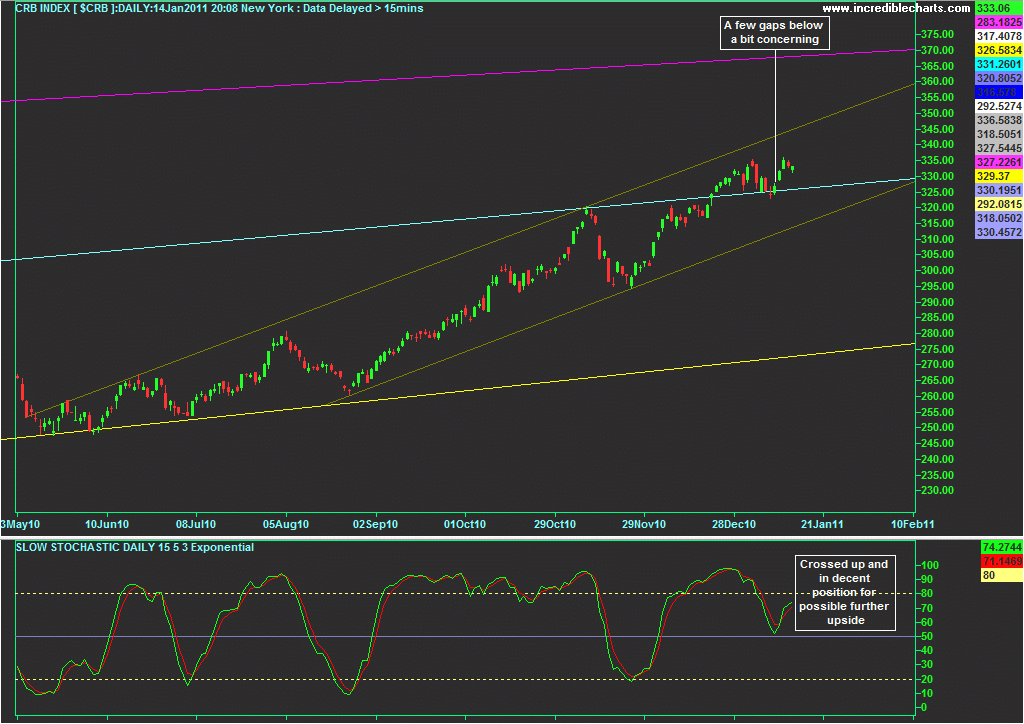
CRB (commodity index) daily chart (8 months)
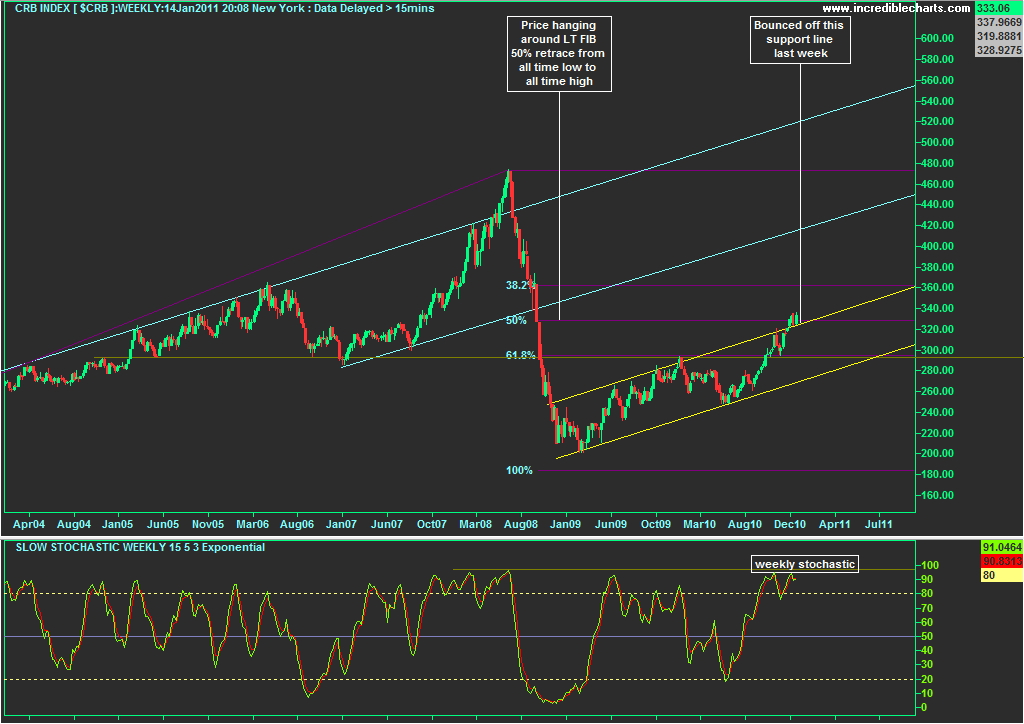
CRB weekly chart (7 years)
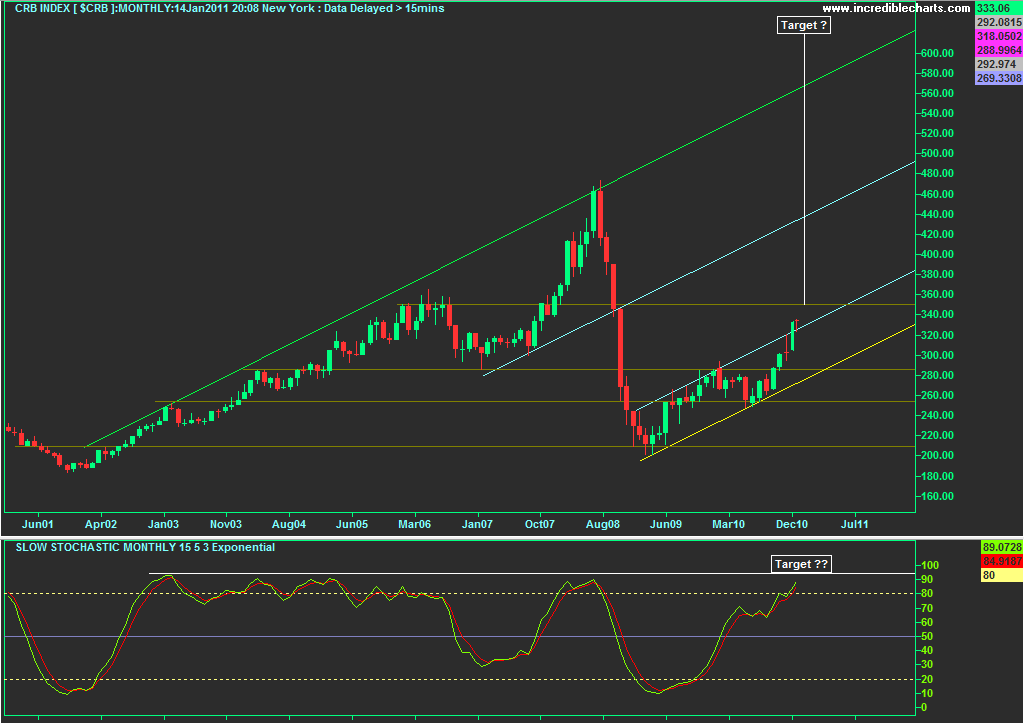
CRB 10 year monthly chart with monthly slow stochastic
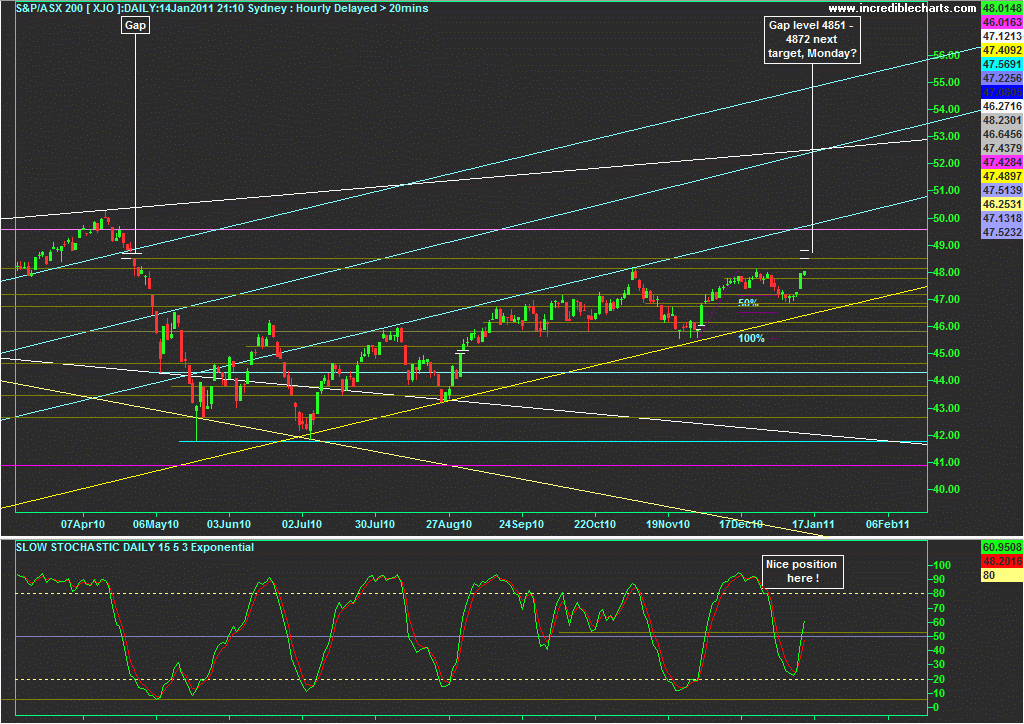
XJO daily
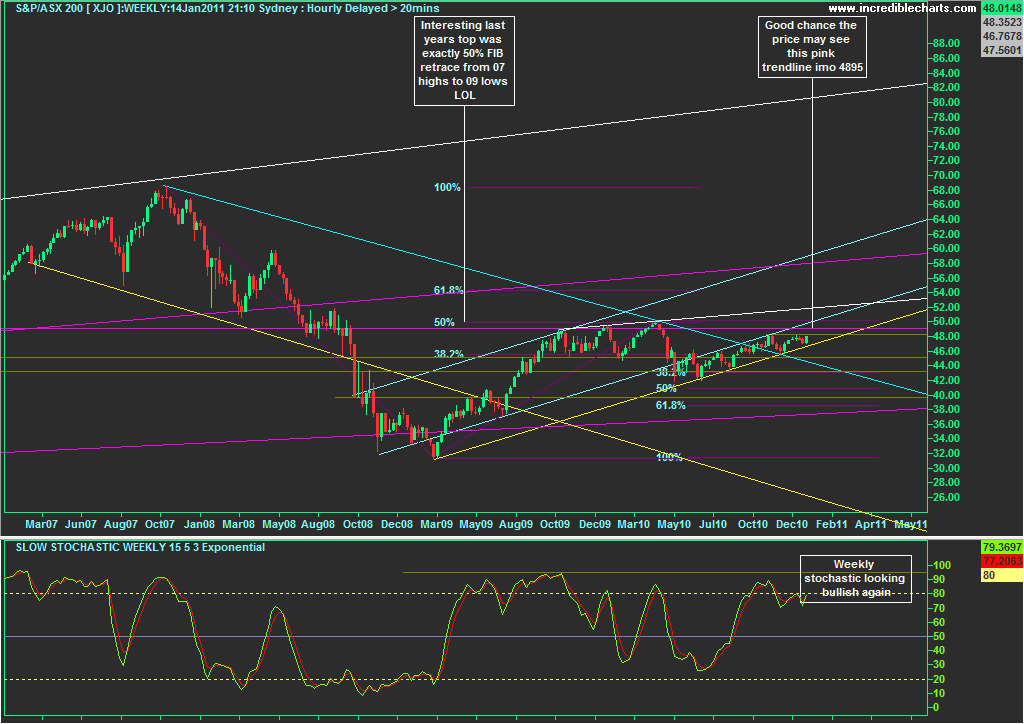
XJO weekly chart with weekly slow stochastic
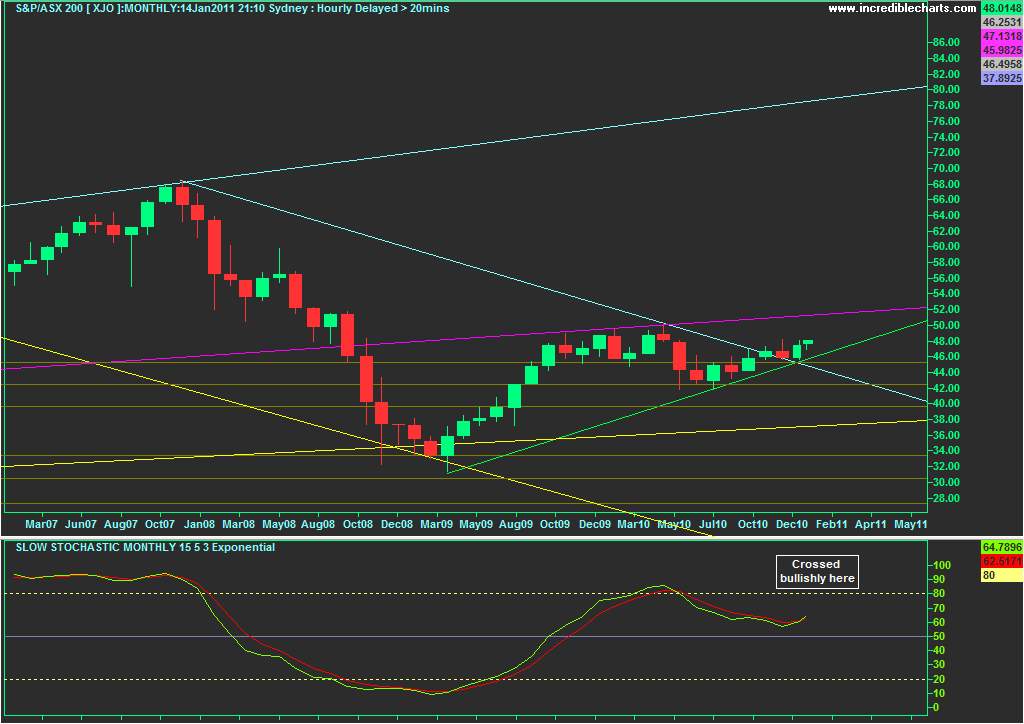
XJO monthly ( 4 years) with monthly slow stochastic
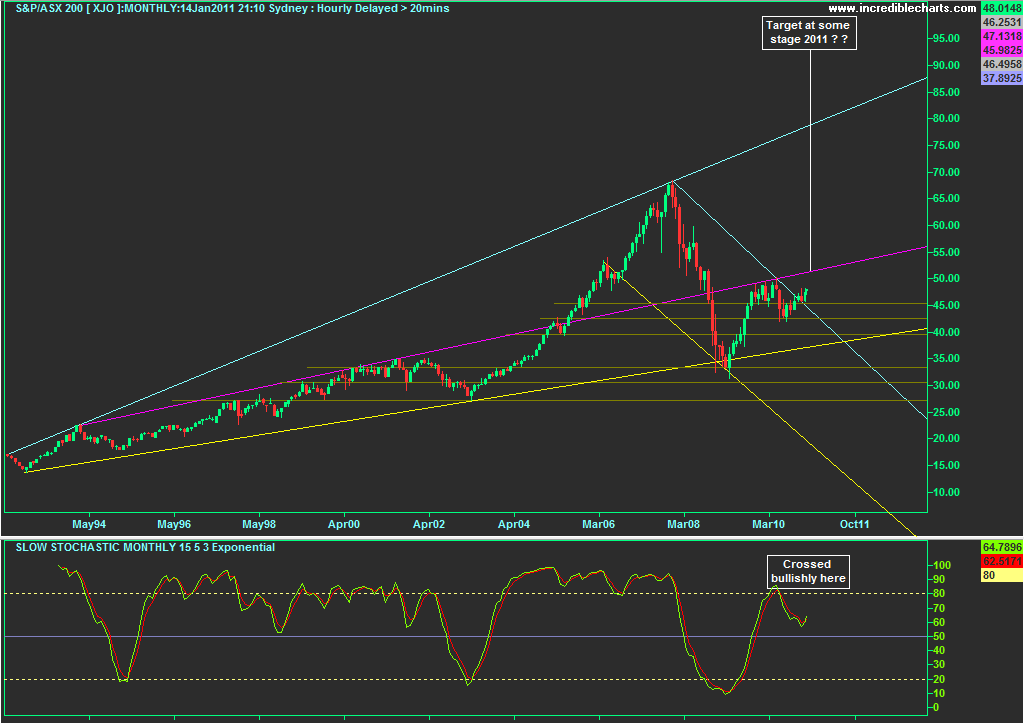
XJO monthly (18 years) with monthly slow stochastic
- Forums
- ASX - By Stock
- XJO
- a few charts of interest
a few charts of interest
-
- There are more pages in this discussion • 45 more messages in this thread...
You’re viewing a single post only. To view the entire thread just sign in or Join Now (FREE)
Featured News
Add XJO (ASX) to my watchlist
 (20min delay) (20min delay)
|
|||||
|
Last
8,091.9 |
Change
46.800(0.58%) |
Mkt cap ! n/a | |||
| Open | High | Low |
| 8,045.1 | 8,091.9 | 8,045.1 |
Featured News
| XJO (ASX) Chart |
The Watchlist
1CG
ONE CLICK GROUP LIMITED
Mark Waller, MD
Mark Waller
MD
Previous Video
Next Video
SPONSORED BY The Market Online


