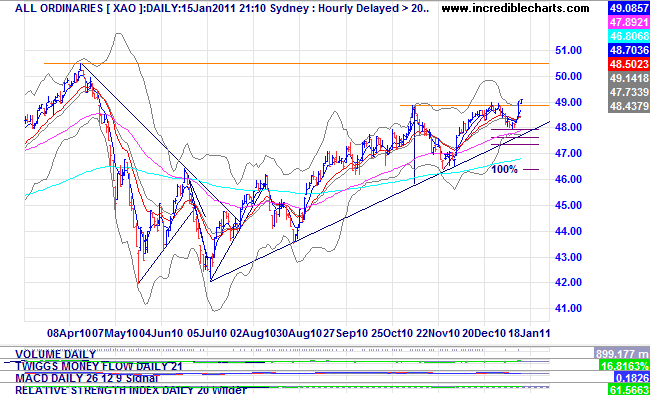
Lazy afternoon, had a look at the XAO chart. It appears that not only does it resemble the XJO chart and indicators but looks as if it has already started its break above resistance of 4885-4888. No resistance from here to 5050. Only a matter of time.
- Forums
- ASX - By Stock
- a few charts of interest
Lazy afternoon, had a look at the XAO chart. It appears that not...
Featured News
Add XJO (ASX) to my watchlist
 (20min delay) (20min delay)
|
|||||
|
Last
8,193.4 |
Change
-62.200(0.75%) |
Mkt cap ! n/a | |||
| Open | High | Low |
| 8,255.6 | 8,255.6 | 8,139.1 |
Featured News
| XJO (ASX) Chart |


