Charles Rotter / 4 hours ago Reposted from Dr. Judith Curry’s Climate Etc. Posted on February 24, 2020 by curryja | by Alan Longhurst Recipe for Australia’s climate ‘truth bomb’: dubious manipulations of the historical temperature record, ignorance of the climate dynamics of the Southern Hemisphere, and ignorance of Australia’s ecological and social history.
A correspondent of The Guardian newspaper writes that her personal ‘climate truth bomb’ hit her while she was picking ash from her glass at a wine tasting event – the Sydney Harbour bridge being dimly seen through the murk of bushfires. The truth came to her, she wrote, in the eloquent rage of Greta Thunberg and also in heat, smoke and fire. Although anthropogenic climate change sells well, especially at The Guardian, their Sydney correspondent cannot be so ignorant about the climate of Australia or about bushfires as she pretends. Put briefly, bushfires in Australia and elsewhere have two main sources: from thunderstorms or from human activity, deliberate or otherwise – cigarette butts, sparks from brakes on railway trains, from incautious welding on farm machinery and from electric transmission lines. In California, where almost 2 million acres burned in 2018 and claimed many lives, the electricity supply company now closes down its transmission lines in windy conditions to prevent sparking and fires.
As she should have known, climate change or not, that ash in The Guardian correspondent’s wine was very probably caused by the direct action of an Australian citizen. In the current drought, 36% of fires have been judged to be accidental, 37% as suspicious, 13% as deliberate and only 6% as natural. And that pattern is not new: Australia has a serious arson problem. “In short, up to 85 bushfires begin every day because someone leaves their house and decides to start one,” said Dr. P. Reid of the Australian Center for Research in Bushfires and Arson The geography of the Australian continent is a special case, fire-wise. It has very flat terrain without major mountain ranges, and no major gulfs to allow marine weather to penetrate inland. The pattern of rainfall is driven by the wind systems over the surrounding oceans: Pacific, Indian, Southern. The strength of the SE Trades across the breadth of the Pacific Ocean, and the moisture they transport, are paramount for rainfall in Queensland. But periodically the trades fail during Niño events and so rainfall is intermittent and decade-long dry periods are the rule rather than the exception, especially in the eastern part of the continent.
In New South Wales and Victoria, rainfall variability is also influenced by the dynamics of the Antarctic Ocean, with blocking highs developing over the ocean; in western Australia, the dynamics of the Indian Ocean are important in carrying moisture to the continent. But, overall, the ‘canonical driver of Australian rainfall’ is the alternating state of the SE Trades, according to Risbey and his colleagues. So periodic droughts, more frequent in the east, are the inevitable consequence of Australian geography. The indigenous vegetation and fauna was evolved to deal with these conditions and the pre-settlement human population had, likewise, evolved a lifestyle that placed sufficiently modest demands on the environment that their survival was assured. This included lighting seasonal ‘cool’ fires that prevented the build-up of dead vegetation and produced a mosaic of burned and unburned land: this technique has now been reintroduced in the Kimberly region and ‘right across the North’ [link] But the wave of settlement during the 19th century by European pastoralists, who did not understand their new environment, changed all that very fundamentally: ‘sheep were cheap, water was available and graziers relied on saltbush and scrub to provide quality feed when overgrazing had destroyed the perennial grass [link] Rabbits, naively introduced in 1859, were in plague numbers over most of southeast Australia by the end of the century – busily digging out the roots of native vegetation, and ring-barking shrubs. After logging, the regenerating eucalypt woodlands lacked (and much still lacks) a closed canopy, a condition which encourages dry, shrubby ground cover and the propagation of fire. In short, settlement was disastrous for the original drought-adapted environment of the interior of Australia and it was not long before the inevitable occurred, even without the help of rabbits. Since reliable records began to be kept, a ‘severe’ drought has been recorded on average every 18 years, since that of 1803 which caused crop failures in New South Wales: each was accompanied by widespread bushfires.
The years 1871, 1895-1902, 1926, 1928, 1931, 1939, 1982 and 2009 each have their own Black day-of-the-week and notable high temperatures: the Black Friday fire of February 1931 burned 5 million ha. or 25% of the state of Victoria, claiming 12 lives, plus a million sheep and many cattle. Images of dead stock and advancing dust-storms abound from those years, local newspapers headlined maximum temperatures and wrote of hardship and abandoned farms; trains were immobilised by dust storms having updrafts so strong that they emitted ball lightning. Conditions during the Federation drought of 1895-1903 were very severe indeed, and a land surveyor recorded that he feared the heat would cause the mercury bulb of his thermometer to burst.
Today, it is widely believed in Australia that the drought and fire-storms of 2019 were the consequence of CO2-driven anomalously high air temperature; long forgotten is the fact that very high temperatures were reliably recorded during earlier droughts. During the Millennium drought of south-eastern regions from 1996 to 2010, the highest temperature recorded at Melbourne was 46.4oC in February 2009 – but on Black Thursday of 1851 Melbourne recorded 117oF (47oC) and on Black Friday of 1939 the same place recorded 45oC.
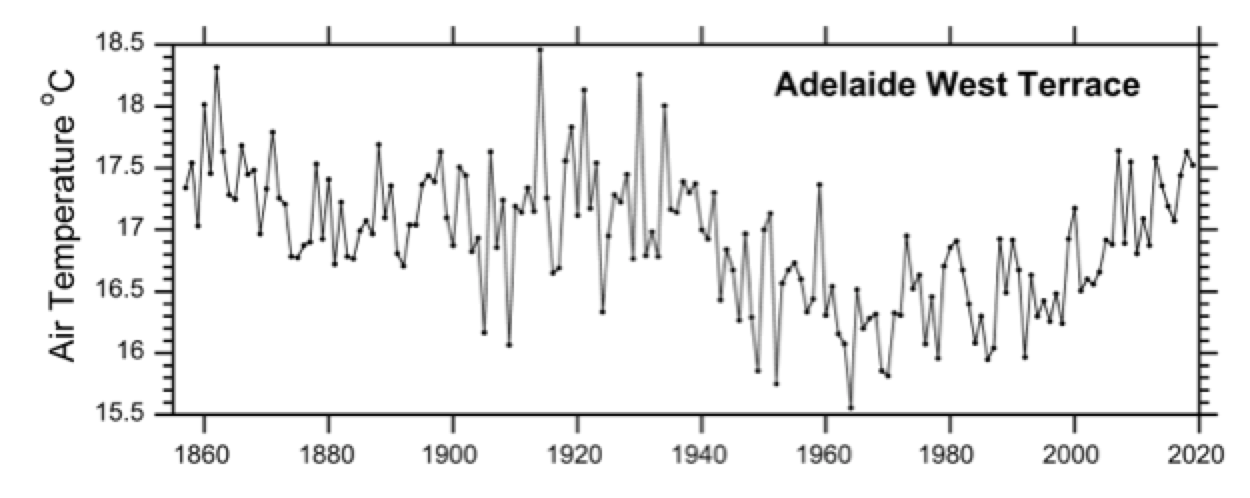
These are conditions sufficiently similar to those of the recent drought as not to make a great deal of difference to those enduring them: that is a strong statement, but it is supported by the Australian network of meteorological observations, which has a spatial coverage second only to that of the USA – and includes stations having continuous data since the 1880s. Observations were established in the early years of the Federation along with the telegraph network, and Australia boasts one of the very longest continuous records globally: observations in Adelaide began in 1856, but you will find the early data have been expunged from the currently-used Australian archives.
Note: The GHCN data is used in this text to avoid the consequences of the post-hoc adjusting of the observations by NOAA, NASA and by the Australian BOM, discussed below.
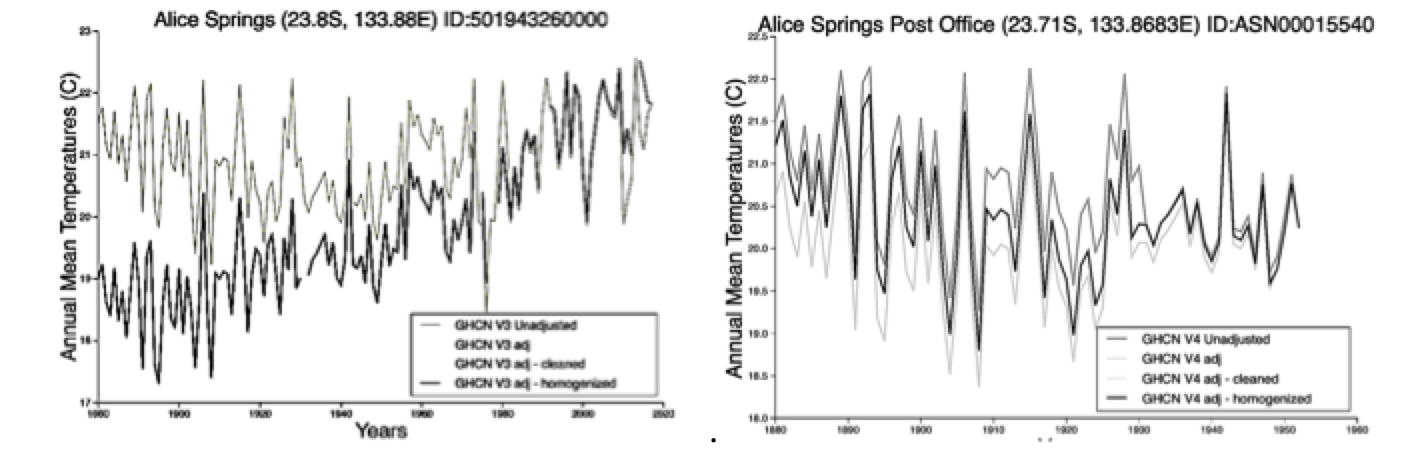
Until recently, these observations were made at West Terrace which is a large well-grassed city park with botanic gardens, open to the four winds. The station was moved 3.5 km in 1979. Observations were obtained with mercury thermometers in Gleisher frames or Stevenson screens up to about 1910, although in some outback locations there was probably some improvisation: Stevenson screens became standard after 1910 right up to the progressive introduction of electronic sensors in the 1990s. A comparison showed that Stevenson temperatures were 0.5-1.00C warmer during daytime than in the better-ventilated Gleisher frames: night temperatures were identical in both, winter daytime differences being about half of those of summer. [link] There has been much reluctance to accept the validity of data from the period prior to 1910, when Stevenson screens came to be used everywhere, and this example from NASA Goddard (copied about two years ago) shows an astonishing solution: adjust the earliest homogenised (black line) observations by -3oC and progressively decrease this offset until the adjusted data become compatible with the unadjusted observations (grey line). Fortunately, perhaps because of the support given by many other rural data to the original observations, NASA seems to have come to its senses since then, and now in 2020 (right plot) offers a more sensible interpretation that accepts the original data as having been correct. But this now contradicts the interpretation of the Alice Springs observations by the Australian Bureau of Meteorology (BOM) in their much-criticised ACORN-SAT archive (to be discussed later).