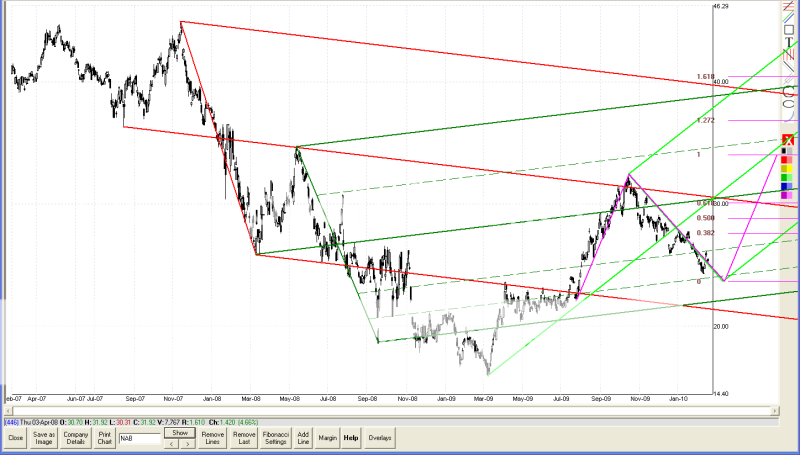
I had a look at Rob's analysis, and GJ's. I though I might add a shorter term analysis to give a counter point. Forgive the fact that most of the chart is empty, but I need it for reference.
The ST fork is running down. Price broke out upwards but was contained by the first warning line. Price has recently tested that line, and the line won, so it is probably appropriate to look for true support to tell us where the down trend might be broken and perhaps a trend reversal take place as distinct from a consolidation. I have therefore charted in 2 measured moves.
The black MM, which roughly approximates 2 of Rob's repeating ranges did a good job of estimating the support point for the second move. If we assume that there is another move going, where I have drawn the orange MM, it terminates on that line where I have drawn horizontal support. It could therefore be reasonable to expect that the down move will terminate there, or at worst, extend to the orange 1.618 I have drawn in.
If I am wrong and the current move is actually an extension of the first (black) MM the black 1.618 is also drawn in.
If I assume that we have correctly identified support, I should be able to draw a new pitchfork, which should have some tell tale signs the typify the patterns around around pitchforks, so I drew one in.
I found that if I used the black 1.618, I almost got touches on th median line and the ML went straight through the top of the gap, which is typical behaviour for MLs. If I lowered the swing point estimate to the the main horizontal support, the ML was hard up against the bottom of the gap, but the ML touches were a much poorer fit.
Not sure if any of this will work out exactly, but I have estimated this stuff enough to know it is a much higher probability. I will be watching for the swing point, as the bank rally is still my favorite game.
Assuming the swing points are correct, a Measured Move from the black 1.618 would target the area around 34.90 before the div rally petered out.
In the 3rd chart I have placed the estimate from a measured move in pink, and drawn the estimate of the rally fork in light green. I notice the MM goes to the light green ML, which is the sort of thing you would expect, and the 1.618 extension goes to the top line of the rally fork, which is a long way up, and should be out of reach.
I have also placed dark green and red forks which look to identify old support/resistance parallels
NAB Price at posting:
$25.33 Sentiment: None Disclosure: Not Held
A personalised tool to help users track selected stocks. Delivering real-time notifications on price updates, announcements, and performance stats on each to help make informed investment decisions.


 (20min delay)