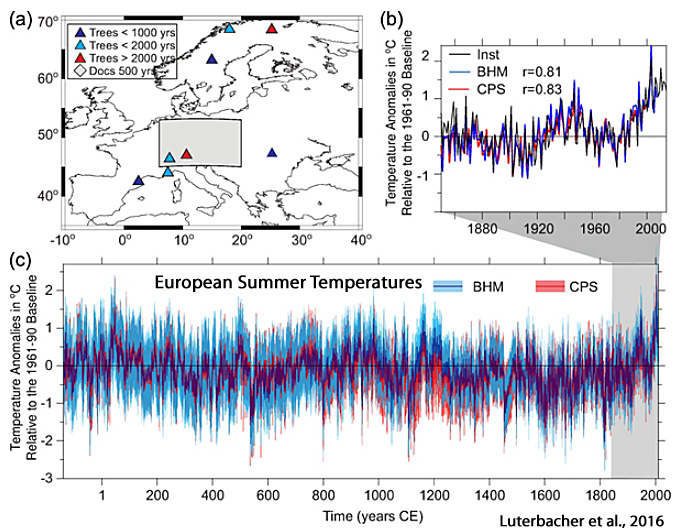
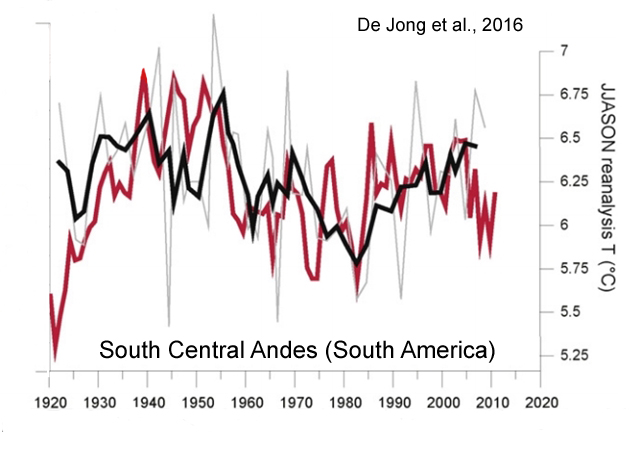
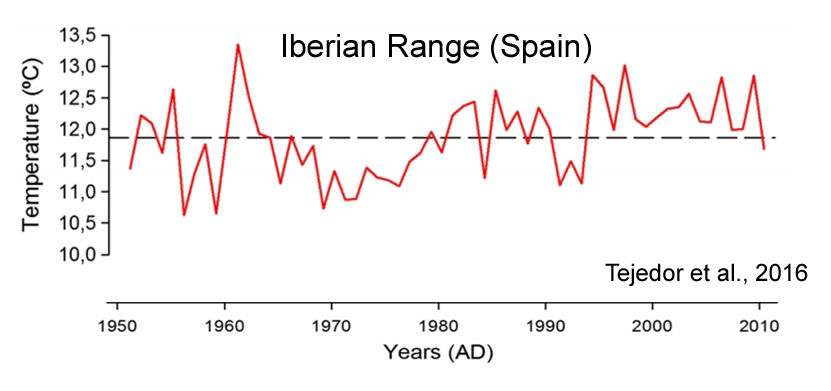
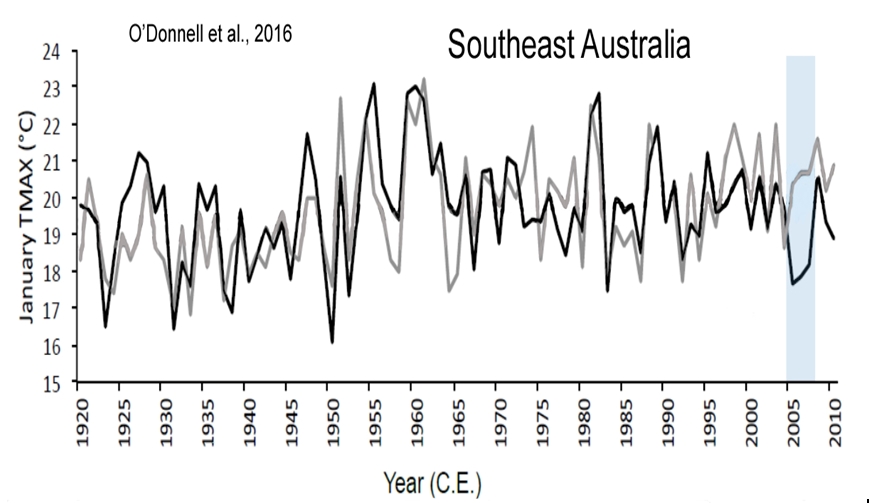
“[T]he reconstruction…shows that recent warming (until AD 2009) is not exceptional in the context of the past century. For example, the periods around AD 1940 and from AD 1950–1955 were warmer. This is also shown in the reanalysis data for this region and was also observed by Neukom et al. (2010b) and Neukom and Gergis (2011) for Patagonia and central Chile. Similarly, based on tree ring analyses from the upper tree limit in northern Patagonia, Villalba et al. (2003) found that the period just before AD 1950 was substantially warmer than more recent decades.”
“resent-day global mean air temperatures may have been equally high around 1000 years ago during the so-called Medieval Climate Anomaly(MCA; Lamb, 1969; Grove and Switsur, 1994). However, since regional temperature reconstructions display large variability in the timing and magnitude of the MCA (PAGES 2k Consortium, 2013), this issue has not yet been adequately settled. Hence, there is still a great need to produce and improve empirical proxy data to further our understanding of near and distant climate changes.”
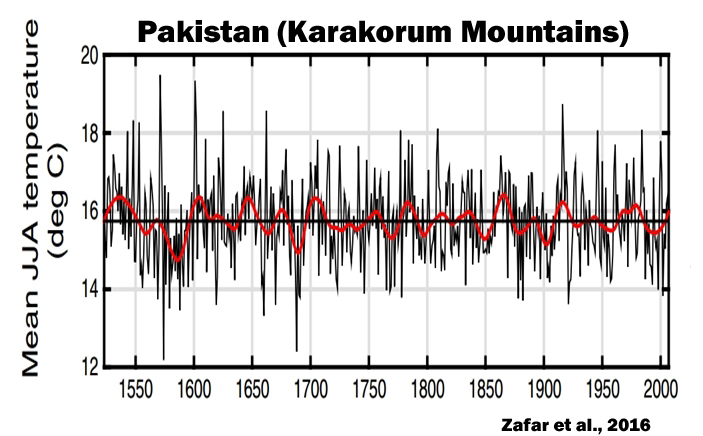
“[O]ur results indicate that Karakorum temperature has remained decidedly out of phase with hemispheric temperature trends for at the least the past five centuries”
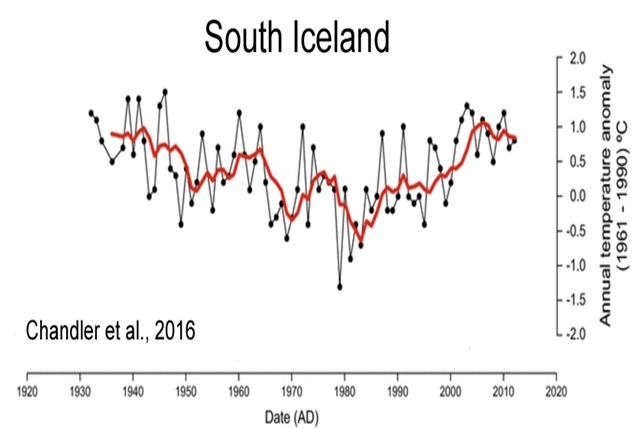
“Analysis of climate data for SE Iceland also indicates that the three periods of ice-frontal retreat [1936-’41, 1951-’56, and 2006-’11] identified are associated with similar summer air temperature values, which has previously been shown to be a key control in terminus variations in Iceland. We, therefore, demonstrated that the coincidence of the most recent phase of ice-frontal retreat at Skálafellsjökull (2006–2011) and warming summer temperatures is not unusual in the context of the last ~80 years. This highlights the need to place observations of contemporary glacier change in a broader, longer-term (centennial) context.”
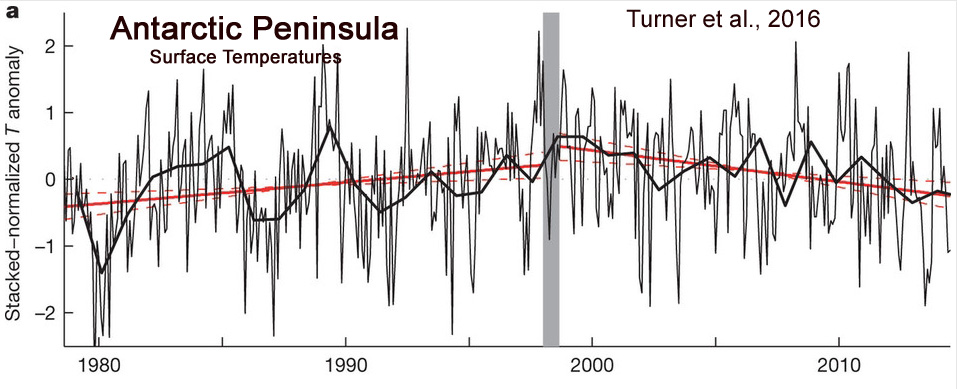
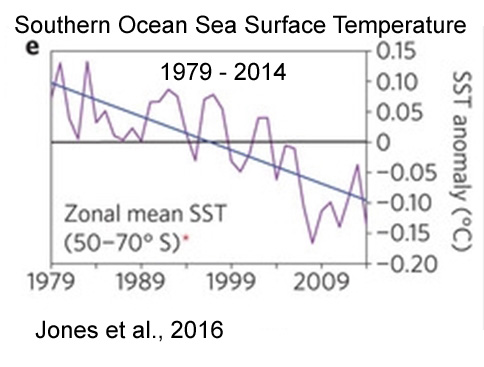
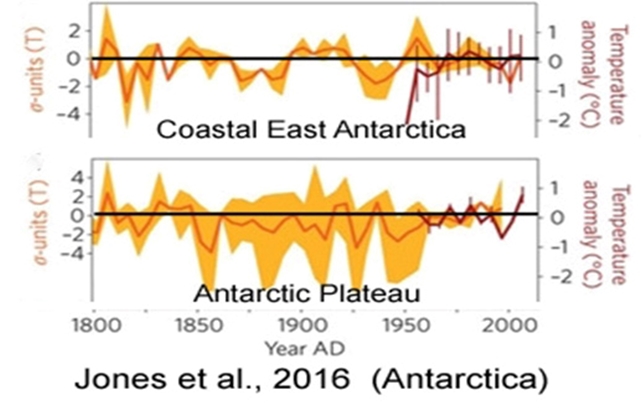
“[C]limate model simulations that include anthropogenic forcing are not compatible with the observed trends. … Over the 36-year satellite era, significant linear trends in annual mean sea-ice extent, surface temperature and sea-level pressure are superimposed on large interannual to decadal variability. Most observed trends, however, are not unusual when compared with Antarctic palaeoclimate records of the past two centuries.”
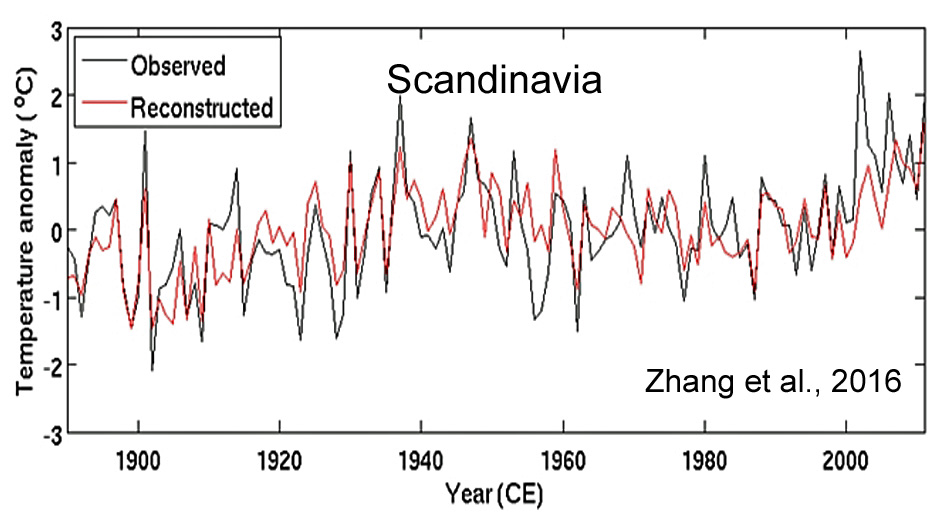
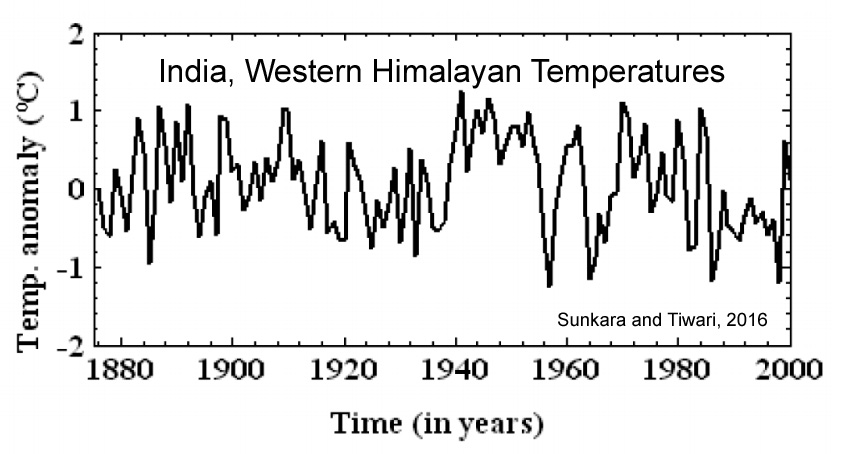
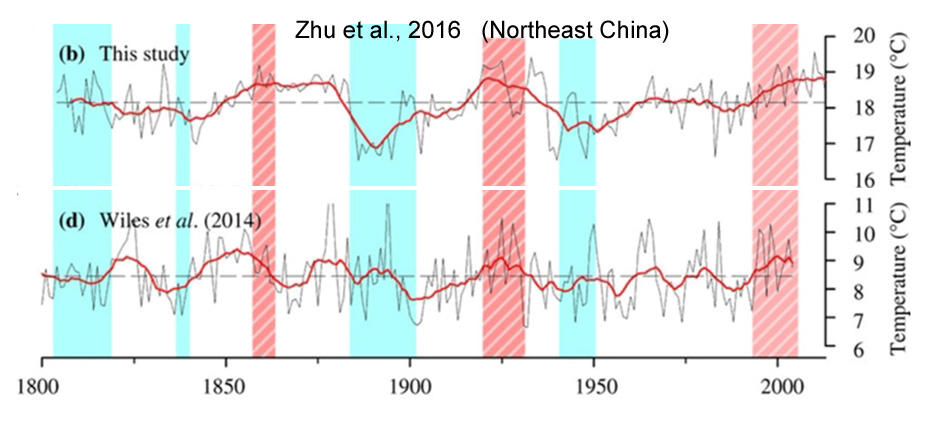
“We identified four major cold periods (1839–1846, 1884–1901, 1906–1908 and 1941–1958) and three major warm periods (1855–1880, 1918–1932 and 1998–2013) in the past 211 years. The multi-taper method spectral analysis revealed significant cycles at 48.8, 11.5, 8.9, 3.9, 3.5 and 2–3 years, which might be associated with global climate oscillations and land-sea thermal contrasts, such as the sea surface temperatures, El Niño-Southern Oscillation, Atlantic Multidecadal Oscillation and solar activity.”
“We determined that temperatures for the ablation measurement periods in late July to early September were similar in both 1933 and the recent period[1990s – present], indicating that the temperature forcing of ablation within the early warm period and the present are similar.”
“Solar activity modulates patterns in surface temperature and pressure that resemble NAO phases, through dynamical coupling processes between the stratosphere and the troposphere that transmit the solar signal to the Earth’s surface.”
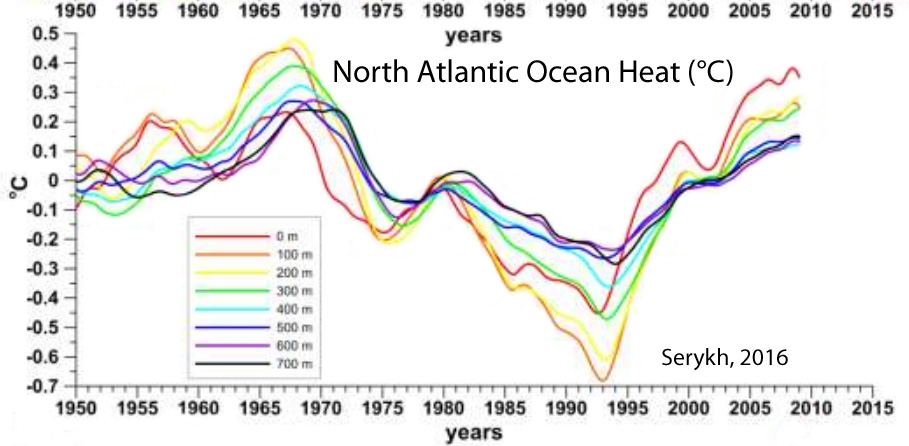
“The very fast climate warming of the Euro-Asian continent that began in the 1970s may be associated with the enhanced heat transport from the North Atlantic in this period. This is evident from the fields and time series obtained in the present paper. The hiatus of this warming after 1999 may be due to the decreased heat transfer from the North Atlantic Ocean to the Eurasian territory.”
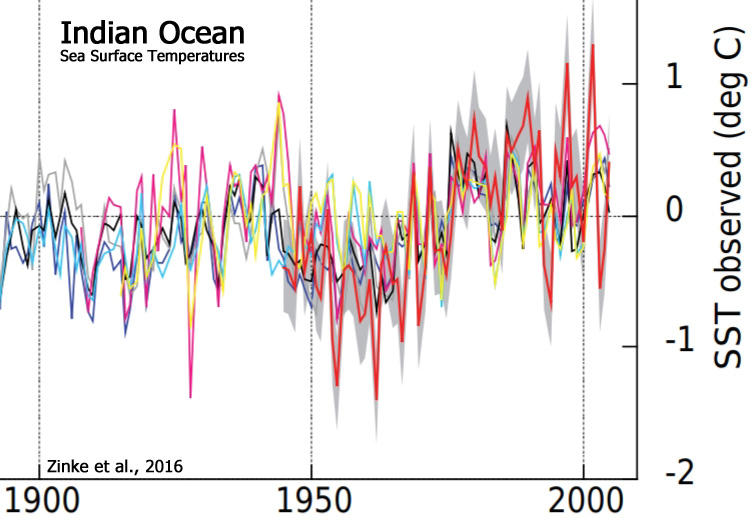
“We calibrate individual robust Sr / Ca records with in situ SST and various gridded SST products. The results show that the SST record from Cabri provides the first Indian Ocean coral proxy time series that records the SST signature of the PDO in the south-central Indian Ocean since 1945. … Marked negative Sr /Ca anomalies (warmer) are observed during the first half of the 20th century centred at 1918/19, 1936–1941 and in the period 1948–1951 that exceed anomalies in the 1961 to 1990 reference period.”
“The time frame is 1883-2014. … Varying the parameters of the construction methodology creates 333 time series with a central trend-value based on the largest group of stations of -0.07 °C decade-1 with a best-guess estimate of measurement uncertainty being -0.12 to -0.02 °C decade-1. This best-guess result is insignificantly different (0.01 C decade-1) from a similar regional calculation using NOAA nClimDiv data beginning in 1895. … Finally, 77 CMIP-5 climate model runs are examined for Alabama and indicate no skill at replicating long-term temperature and precipitation changes since 1895.”
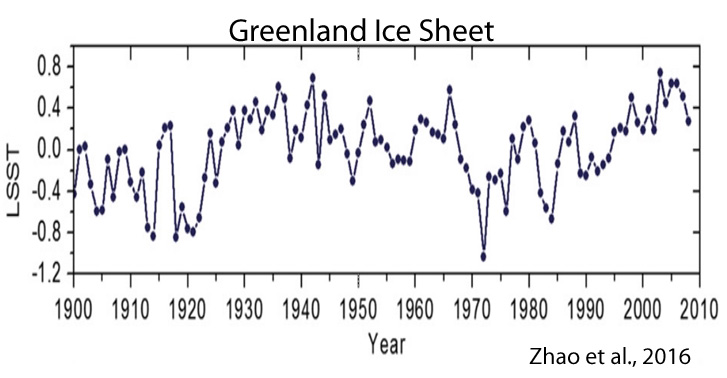
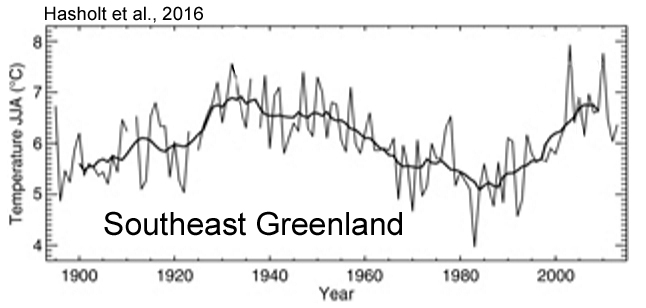
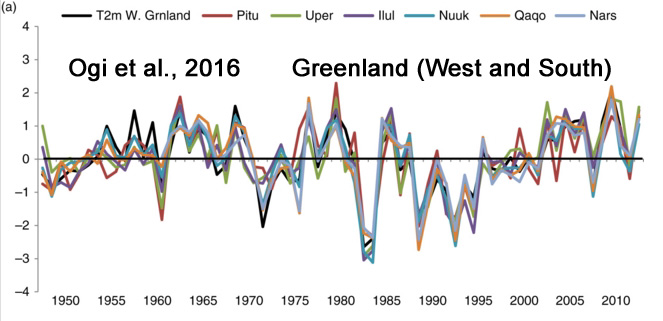
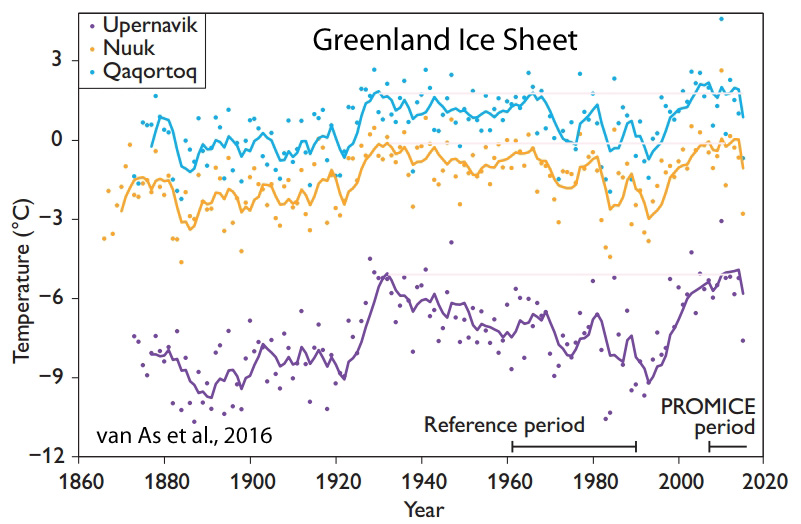
“We conclude that at our study sites annual net ablation is likely to be larger in recent years than during any previous period in the instrumental era, covering up to 150 years. …n southern Greenland ablation peaked significantly around 1930. While most of Greenland underwent relatively warm (summer) conditions in the 1930s (Cappelen 2015), this was most notable at the more southern locations, resulting in amplified ablation values according to our estimates. JJA [summer] temperatures were higher in 1928 and 1929 than in any other year of the Qaqortoq record, both attaining values of 9.2°C. This suggests that ablation in those years may have exceeded the largest net ablation measured on the Greenland ice sheet ( 2010).”
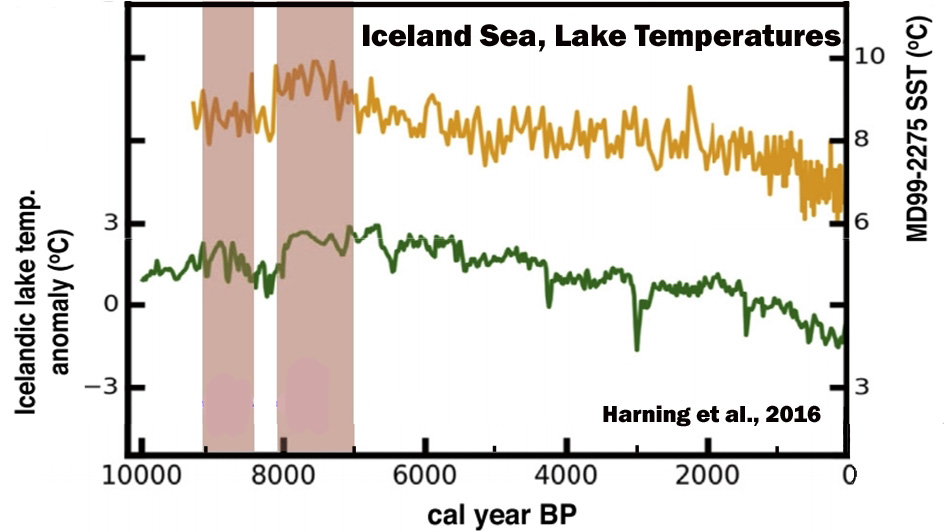
“Distal lakes document rapid early Holocene deglaciation from the coast and across the highlands south of the glacier. Sediment from Skorarvatn, a lake to the north of Drangajokull, shows that the northern margin of the ice cap reached a size comparable to its contemporary limit by ~10.3 ka. Two southeastern lakes with catchments extending well beneath modern Drangajokull confirm that by ~9.2 ka, the ice cap was reduced to ~20% of its current area.”
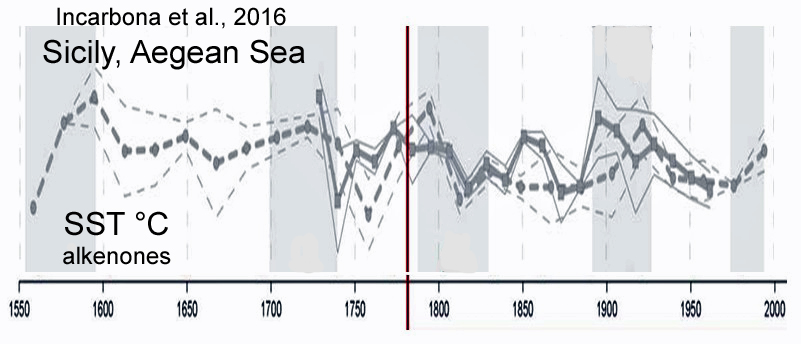
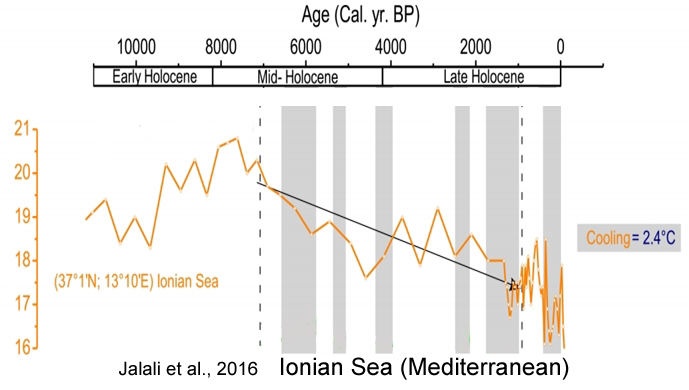
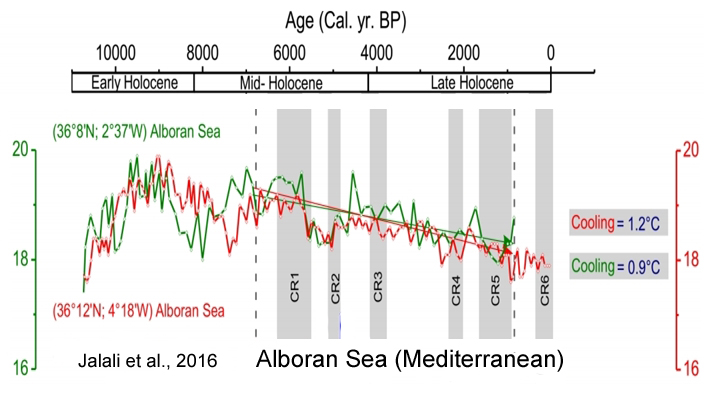
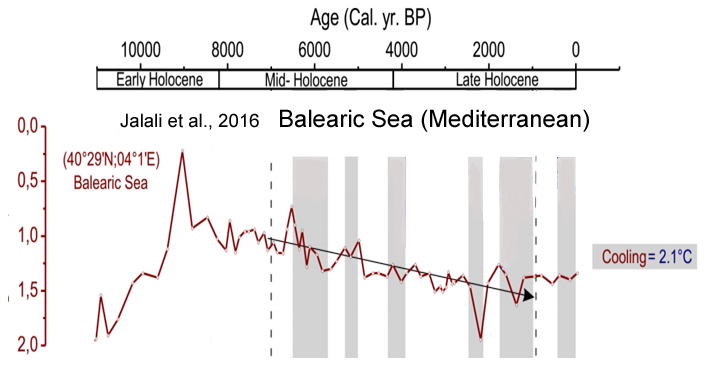
“Several proxy records have documented surface water variability of the Mediterranean Sea during the Holocene (Kallel et al., 1997a, b, 2004; Cacho et al., 2001; Guinta et al., 2001; Rohling et al., 2002; Emeis et al., 2003; Essalami et al., 2007; Frigola et al., 2007; Castañeda et al., 2010; Boussetta et al., 2012; Martrat et al., 2014). Most of them reveal that Mediterranean Sea surface temperatures (SSTs) have undergone a long-term cooling punctuated by several cold relapses (CRs; Cacho et al., 2001; Frigola et al., 2007). While orbital forcing likely explains this long-term tendency, solar activity and volcanism contribute to forced variability(Mayewski et al., 2004; Wanner et al., 2011) together with internal variability (i.e. Atlantic multi-decadal variability (AMV), North Atlantic Oscillation; NAO) all together embedded in the multi-decadal scale variability seen in paleorecords.”
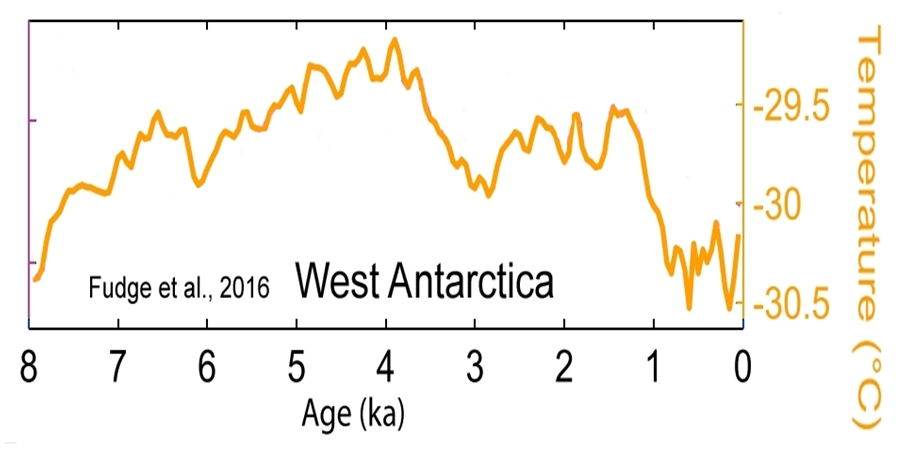
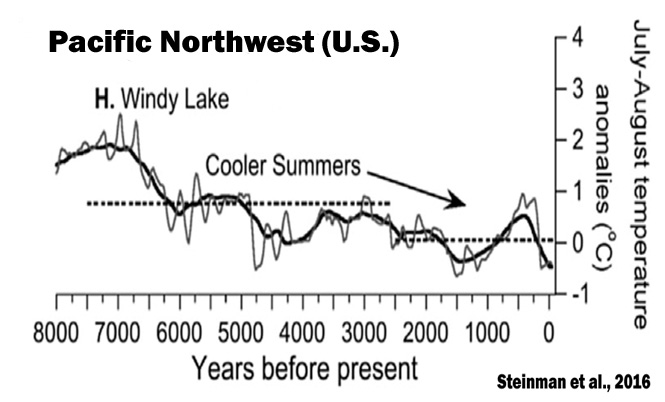
“[R]ecent air temperatures (1993–2003) are, on average, 0.5 °C lower than air temperatures estimated during the MWP [Medieval Warm Period] and Holocene Climate Optimum. … eriods warmer than modern periods occurred for ∼6.5 ka [6,500 years] including during the HCO and Medieval Warm Period.”
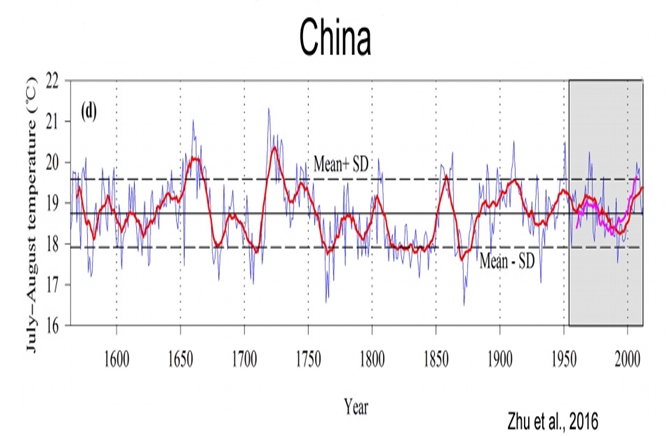
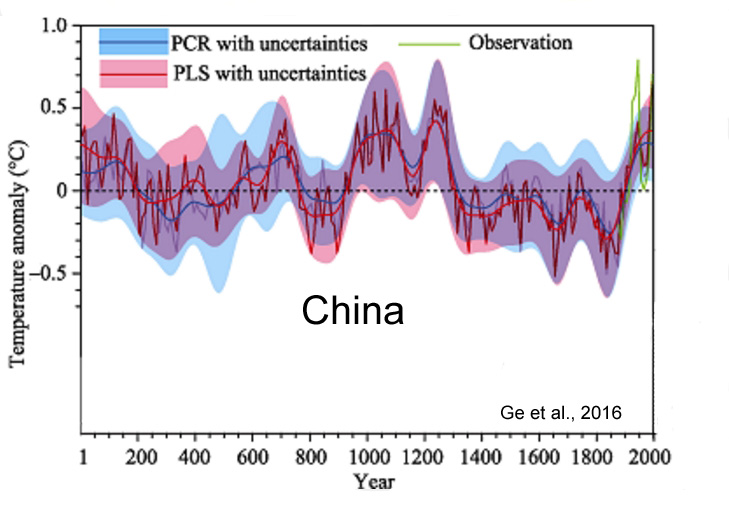
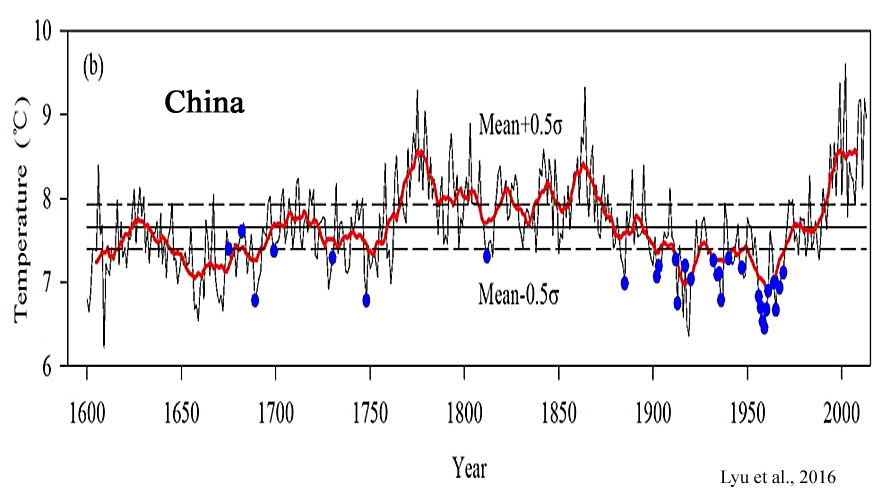
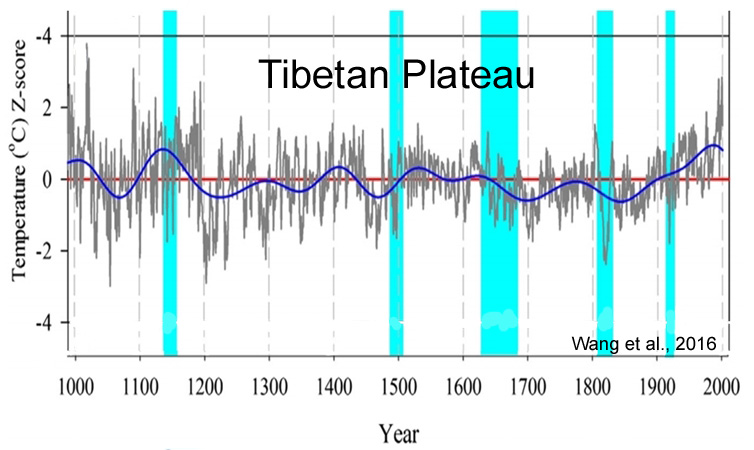
“Results of this study show that warm intervals over the last 2000 years were in AD 1-200, AD 551-760, AD 951-1320, and after AD 1921, while cold intervals were in AD 201-350, AD 441-530, AD 781-950, and AD 1321-1920. Interestingly, temperatures during AD 981-1100 and AD 1201-1270 were comparable to those of our Present Warm Period, but have an uncertainty of 0.28°-0.42°C at 95% confidence level. Temperature variations over the whole of China are typically in phase with those of the Northern Hemisphere (NH) after AD 1000, the period which covers the Medieval Climate Anomaly, the Little Ice Age (LIA), and the Present Warm Period.”
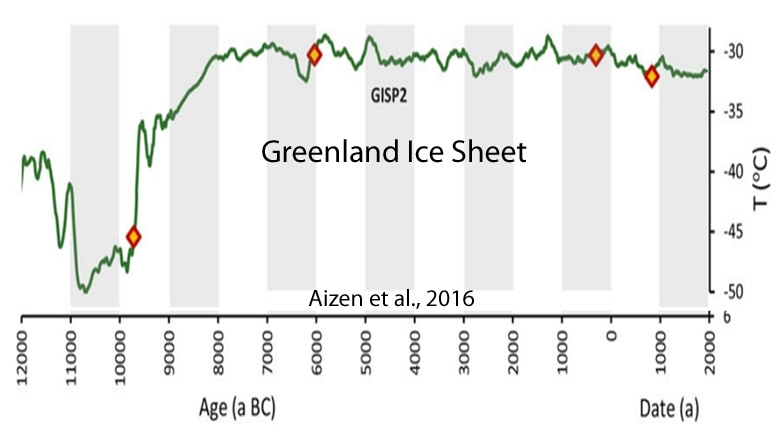
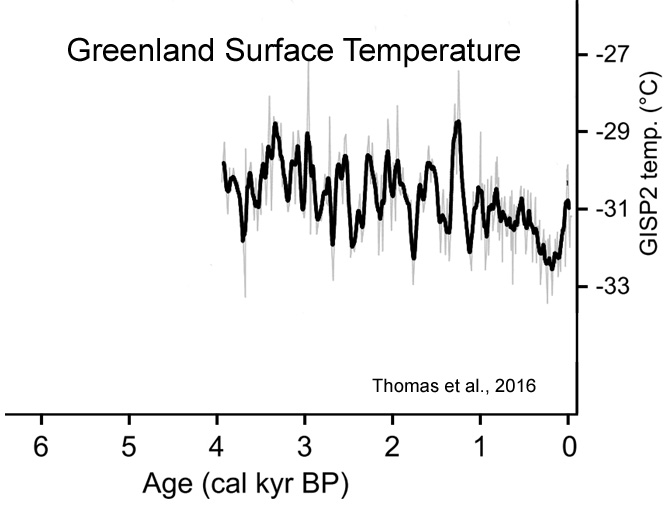
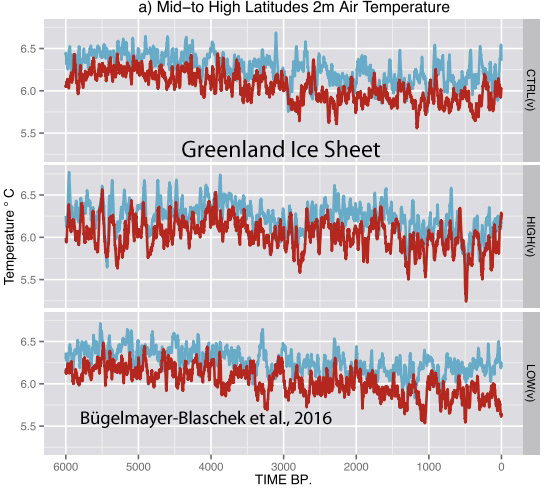
Paired climate and ice sheet records from previous warm periods can elucidate the factors influencing GrIS mass balance on time scales longer than the observational record [Briner et al., 2016]. Duringthe middle Holocene, temperature on Greenland was ~ 2°C higher than present [Cuffey and Clow, 1997; Axford et al., 2013].
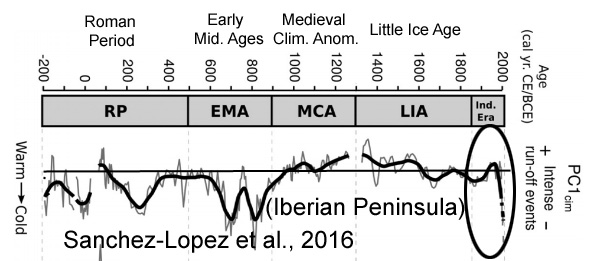
“The dominant warm and arid conditions during the MCA [Medieval Climate Anomaly, 900-1300 CE], and the cold and wet conditions during the LIA [Little Ice Age, 1300-1850 CE] indicate the interplay of the NAO+, EA+ and NAO- , EA- [positive/negative North Atlantic Oscillation, East Atlantic phases], respectively. Furthermore, the higher solar irradiance during the [“warm conditions”] RP [Roman Period, 200 BCE – 500 CE] and MCA [Medieval Climate Anomaly, 900-1300 CE] may support the predominance of the EA+ [positive East Atlantic] phase, whereas the opposite scenario [“colder temperatures”] during the EMA [Early Middle Age, 500-900 CE] and LIA [Little Ice Age, 1300-1850 CE] may support the predominance of the EA- [negative East Atlantic] phase, which would favour the occurrence of frequent and persistent blocking events in the Atlantic region during these periods.”
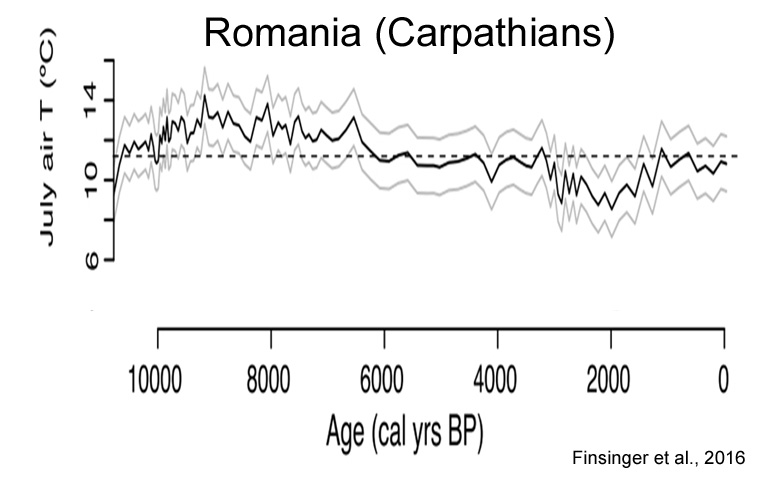
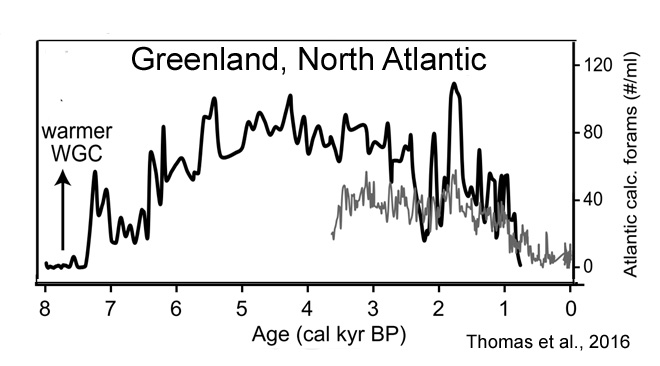
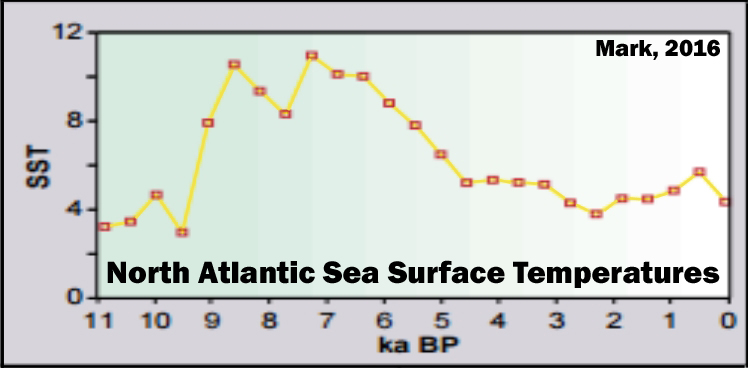
“Much of the North Atlantic shows a maximum between 5000-8000 years B.P. Bradley et. al (2003) compiled a number of marine and terrestrial paleoclimatic proxies from throughout the Holocene which show fairly consistent broad trends in the climatic history of the North Atlantic region. Drawing from isotopic concentrations in ice cores, diatoms, pollen, and dendrochronological analyses, a clear period of elevated temperature, beginning at about 10,000 B.P and concluding at about 6,000 B.P precedes a slow and steady trend of cooling until present day.”
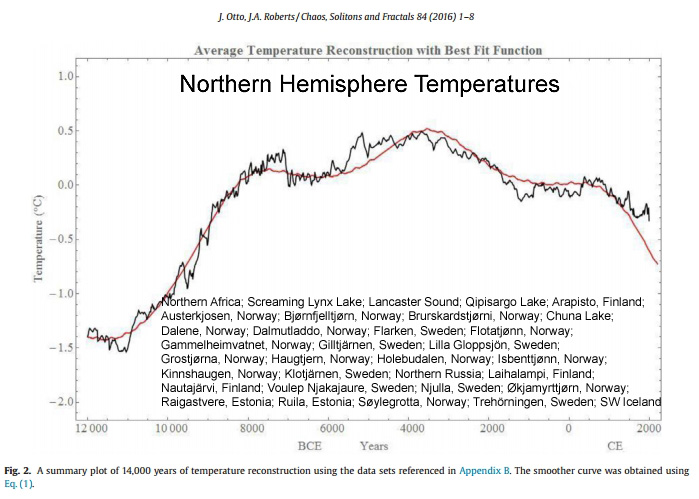
“In addition to temperature records limited to the past 4000 years, data for the past few thousand years were tested. When the data were explored over the past 10,000 years, greater fluctuations in the temperature can be seen with a significant rise in temperature beginning at about 11,000 BCE and ending at 2000 CE with a maximum at about 5,000 BCE.”